


The Dow Theory is widely considered one of the earliest forms of technical analysis.
It was originally promulgated by Charles H. Dow who noticed that stocks tended to move up or down in trends, and they tend to move together, although the extent of their movements could vary.
In 1897, Charles Dow developed two broad market averages. The “Industrial Average” included 12 blue-chip stocks and the “Rail Average” was comprised of 20 railroad enterprises.
These are now known as the Dow Jones Industrial Average and the Dow Jones Transportation Average.
The Dow Theory resulted from a series of articles published by Charles Dow in The Wall Street Journal between 1900 and 1902.
The Dow Theory is the common ancestor to most principles of modern technical analysis.
Interestingly, Charles Dow did not use his observations to forecast potential price movements but saw it as a barometer of the general business climate.
It was not originally intended to forecast stock prices. However, subsequent work has focused almost exclusively on this use of the Theory.
After Dow died in 1902, his close friend, Samuel A. Nelson attempted to explain Dow’s methods in his book, “The ABC of Stock Speculation“.
William P. Hamilton, who succeeded Charles Dow as the Editor of The Wall Street Journal, refined Dow’s principles and developed them into a theory, which he explained in his book, “The Stock Market Barometer: A Study of Its Forecast Value of 1922“.
Both Dow’s work and Hamilton’s work were analyzed and studied by Robert Rhea who refined Dow Theory further into the theory we know today, in his book, “The Dow Theory of 1932“.
Basic Principles of the Dow Theory
The Dow Theory comprises six assumptions:
1. The Averages Discount Everything
The averages discount everything as they reflect the combined activities of thousands, if not millions of traders, speculators, and investors at any one time.
An individual stock’s price reflects everything that is known about it. As new information arrives, market participants quickly disseminate the information and the price adjusts accordingly.
Thus, every known and foreseeable event is discounted, as is every condition that could affect the supply and demand of the individual stocks.
2. The Market Is Comprised of Three Trends
At any given time in the stock market, three forces are in effect: the Primary trend, Secondary trends, and Minor trends.
- The Primary or Major Trend that usually lasts at least one year can continue for many years. This trend is usually responsible for a price movement, up or down, of at least 20%. The Primary Trend is interrupted by the Secondary Trend that moves against the Primary Trend to correct it when it becomes overstretched.
- The Secondary Trend interrupts the movement of the Primary Trend, moving in the opposite direction. However, identifying a Secondary Trend while it is in the process of development is very difficult. The Secondary Trend lasts for at least three weeks but can continue for several months and usually retraces at least 1/3 of the previous price movement. At times the Secondary Trend can fully retrace the preceding movement but it often stops at 1/2 or 2/3 of the preceding movement.
- The Minor Trend is the day-to-day fluctuations of the averages. It usually lasts less than six days and is not given any importance in Dow Theory.
The Dow Theory holds that, since stock prices over the short-term are subject to some degree of manipulation (Primary and Secondary trends are not), Minor trends are unimportant and can be misleading.
3. Primary Trends Have Three Phases
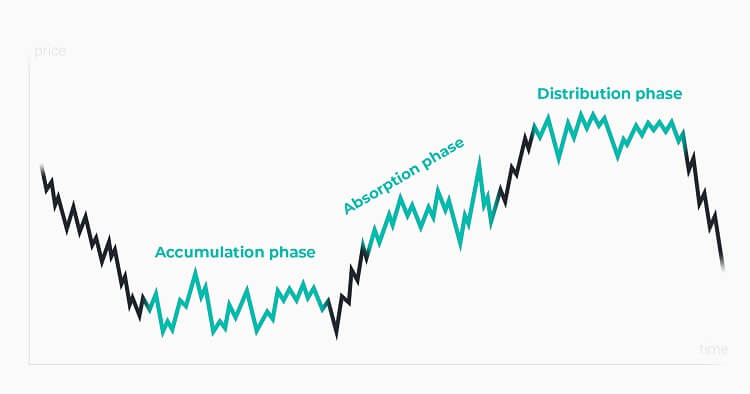
The Bull Market is characterized by an advancing Primary Trend and usually consists of three phases:
- The Accumulation Phase occurs when astute investors start buying stocks at low prices from sellers who are under duress as the economic news is still bad and is often at its worst. Trading activity is usually still moderated during this phase but is starting to increase.
- The Accumulation Phase is followed by a phase that is characterized by steady advances accompanied by increasing activity as improving corporate begins to draw attention. This is usually the most profitable phase for the technical analyst.
- The final phase is characterized by phenomenal advances as more and more of the public are drawn to the market.
The Bear Market is characterized by a declining Primary Trend and like the Bull Market, it also usually consists of three phases:
- The Distribution Phase occurs when the astute investors that bought during the accumulation phase of the previous bull market start to sell their holdings. Trading activity is usually still high during this phase but is starting to decrease.
- The Panic Phase follows as buyers thin out and selling becomes more urgent. The downward trend accelerates to a near-vertical drop characterized by climatic volumes. This phase is usually followed by a long recovery (Secondary Trend) or sideways movement before the final phase begins.
- The final phase is characterized by the discouraged selling of buyers that held through the panic phase or bought during the recovery period. The discouraged selling is not as violent as in the panic phase.
4. The Averages Must Confirm Each Other
The Industrials and Transports must confirm each other for a valid change of trend to occur.
Both averages must extend beyond their previous secondary peak (or trough) for a change of trend to be confirmed.
In other words, the two averages must both be moving in the same approximate direction. If the two averages do not conform to the same trend, then the trend is not 100% valid.
5. The Volume Confirms the Trend
The Dow Theory focuses primarily on price action. Volume is only used to confirm uncertain situations.
Volume should expand in the direction of the primary trend.
- If the primary trend is down, the volume should increase during market declines.
- If the primary trend is up, the volume should increase during market advances.
6. A Trend Remains Intact Until It Gives a Definite Reversal Signal
An uptrend is defined by a series of higher highs and higher lows. For an uptrend to reverse, prices must have at least one lower high and one lower low (the reverse is true of a downtrend).
When a reversal in the primary trend is signaled by both the Industrials and Transports, the odds of the new trend continuing are at their greatest.
However, the longer a trend continues, the odds of the trend remaining intact become progressively smaller.
If this article seems useful to your then please click the like button below. You can also share your valuable feedback or ask questions in the below comment section. Also, subscribe to our newsletter for trading-related updates.


