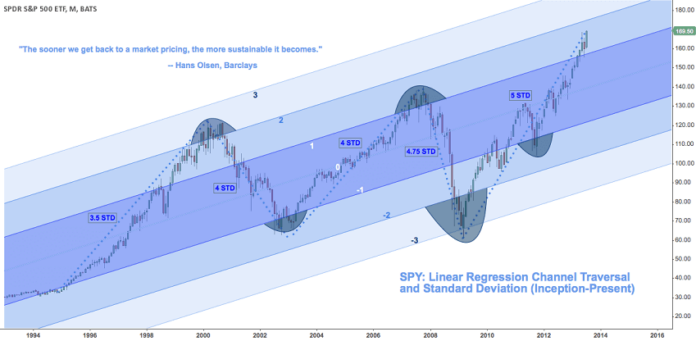
The Linear Regression Channel is a three-line technical indicator used to analyze the upper and lower limits of an existing trend. Linear regression is a statistical tool used to predict the future from past data. It is used to determine when prices may be overextended.
A Linear Regression Channel gives potential buy and sell signals based on price volatility.
It consists of three parts:
- Linear Regression Line
- Upper Channel Line
- Lower Channel Line
Linear Regression Line
A Linear Regression Line is a straight line that best fits the prices between a starting price point and an ending price point.
A “best fit” means that a line is constructed where there is the least amount of space between the price points and the actual Linear Regression Line.
The Linear Regression Line is used to determine trend direction.
The acts as the midpoint of the trend.
Think of the trend line as the “equilibrium” price, where any move above or below the trendline indicates overzealous buyers or sellers.
When prices deviate above or below the line, you can expect the price to go back towards the Linear Regression Line.
When prices are below the Linear Regression Line, this is considered bullish.
When prices are above the Linear Regression Line, this is considered bearish.
Upper and Lower Channel Lines
The Upper Channel Line is a line that runs parallel to the Linear Regression Line and is usually one to two standard deviations above the Linear Regression Line.
It marks the top of the trend.
The Lower Channel Line is a line that runs parallel to the Linear Regression Line and is usually one to two standard deviations below the Linear Regression Line.
It marks the bottom of the trend.
The Upper and Lower Channel Lines are evenly distanced from the Linear Regression Line
The default standard deviation setting used is “1” which means 68% of all price movements are contained between that the Upper and Lowe Channe Lines,
When the price breaks outside of the channels, buy and sell signals are generated.
Types
There are two types of Linear Regression channels, depending on the direction of the trend:
- Bullish Linear Regression channel
- Bearish Linear Regression channel
These two types of regression channels are defined based on their slope.
Bullish Linear Regression Channel
The bullish Linear Regression Channel indicates a bullish trend. The price is increasing and the slope of the Linear Regression is positive.
Bearish Linear Regression Channel
The bearish Linear Regression Channel indicates a bearish trend. The price is decreasing and the slope of the Linear Regression is negative.
How to Draw
To draw the Linear Regression Channel, simply select the beginning of a trend and stretch the indicator to another point of the trend.
The three lines of the Linear Regression Channel will self-adjust depending on the top and bottom of the trend.
The Linear Regression Channel (middle line) will automatically appear between the Upper and Lower Channels.
How to Use
Trading the Linear Regression Channel involves keeping an eye on the price whenever it interacts with one of the three lines.
Each time that the price interacts with the Upper or Lower Channel, you should expect to see a potential turning point on the price chart.
Buy Signal
If you expect a continuation of the trend, and the price falls below the lower channel line, this should be considered a buy signal.
You can wait for confirmation by waiting for the price to move higher and close back inside the Linear Regression Channel.
Sell Signal
If you expect a continuation of the trend, and the price rises above the upper channel line, this should be considered a sell signal.
You can wait for confirmation by waiting for the price to move lower and close back inside the Linear Regression Channel.
Trend Reversals
When price closes outside of the Linear Regression Channel for long periods of time, this is often interpreted as an early signal that the current trend might be ending and a trend reversal might be near.
Overbought/Oversold
The use of standard deviation can give you an idea ono when prices might be overbought or oversold relative to the long-term trend.
If this article seems useful to your then please click the like button below. You can also share your valuable feedback or ask questions in the below comment section. Also, subscribe to our newsletter for trading-related updates.


