


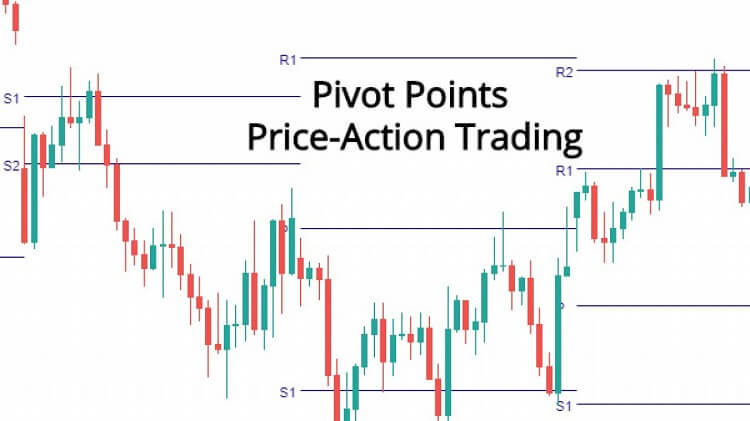
Pivot points, or simply pivots, establish areas of support and resistance by examining the highs, lows, and closing values of an asset.
They are useful for identifying trading ranges, trend reversals, and market sentiment.
In practice, there are many ways to calculate pivot points.
A popular method begins with taking the simple average of a periodic high, low, and closing price, then applying it to a periodic trading range.
The pivot value is calculated via the following formula:
Pivot = (High + Low + Close) / 3
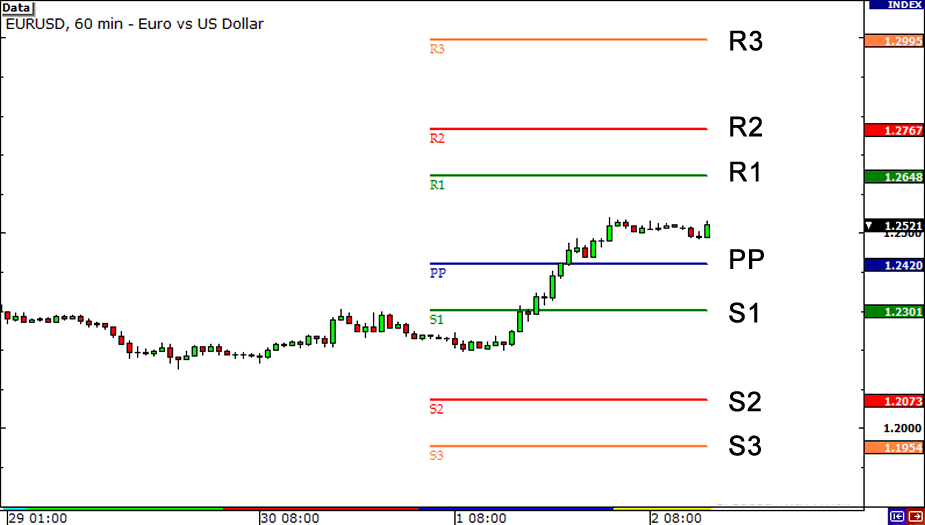
Upon the pivot being derived, it is then used in developing four levels of support and resistance:
Resistance 1 = (Pivot * 2) - Low
Resistance 2 = Pivot + (High - Low)
Support 1 = (Pivot * 2) - High
Support 2 = Pivot - (High - Low)
Pivot points are used in a variety of ways, primarily to indicate the presence of a trending or range-bound market.
A general rule is that when the price is above resistance levels, a bullish trend is present.
If the price is below support levels, a bearish trend is present.
If the price falls between support and resistance, this means that range-bound conditions are present.
Pivot points are a straightforward means of quickly establishing a set of support and resistance levels.
If this article seems useful to your then please click the like button below. You can also share your valuable feedback or ask questions in the below comment section. Also, subscribe to our newsletter for trading-related updates.


