


The Rate-of-Change (ROC) is a technical indicator that measures the percentage change between the current price and the price from x –days ago.
The ROC indicator, which is also referred to as simply Momentum, is a pure momentum oscillator.
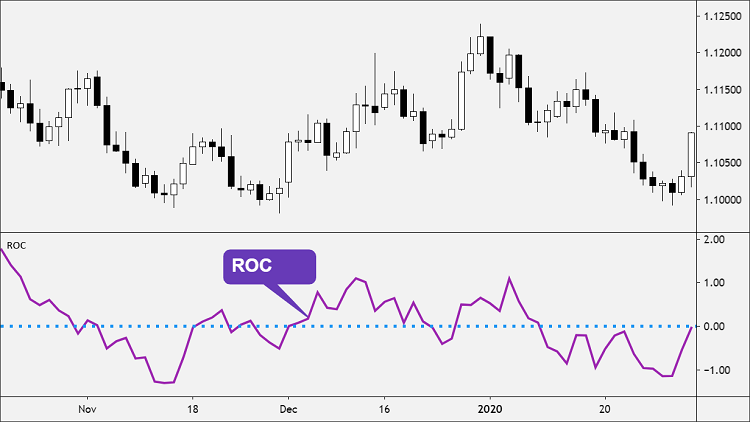
The technical indicator is plotted below the price chart and forms an oscillator that fluctuates above and below the zero line as the Rate-of-Change moves from positive to negative.
Like other momentum indicators, ROC has overbought and oversold zones that may be adjusted according to market conditions.
Remember, a currency pair can become oversold/overbought and remain oversold/overbought for an extended period.
How to use ROC
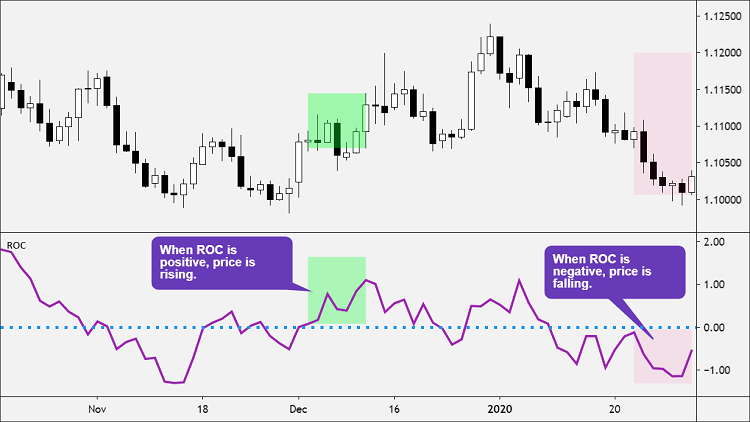
In general, prices are rising as long as the Rate-of-Change remains positive. Conversely, prices are falling when the Rate-of-Change is negative.
ROC expands into positive territory as a rise in price accelerates.
An upward surge in the Rate-of-Change reflects a sharp price advance.
If ROC is positive and rising, buying pressure is increasing.
If ROC is positive but falling, buying pressure is decreasing, and the rise in price is slowing down.
ROC moves deeper into negative territory as a decline accelerates.
A downward plunge indicates a steep price decline.
If ROC is negative, it implies selling pressure, which results in a decrease in price.
The more negative ROC is, the stronger the selling pressure, and the faster the decline in price is.
When ROC crosses above 0, it’s often considered a buy signal.
When ROC crosses below 0, it’s often considered a sell signal.
How to Calculate?
ROC is the percentage change between the current price with respect to an earlier closing price n periods ago.
ROC = [(Today’s Close Price – Close Price n periods ago) / Close Price n periods ago] x 100
ROC for the 10-day period is computed as follows:
ROC = [(Today's Close Price – Close Price from 10 days ago) / Close Price from 10 days ago] x 100
If this article seems useful to your then please click the like button below. You can also share your valuable feedback or ask questions in the below comment section. Also, subscribe to our newsletter for trading-related updates.


