


Calculation
A Weighted Moving Average (WMA) is a type of moving average that puts more weight on recent data and less on past data.
A moving average is a technical indicator that shows you how the price has moved, on average, over a certain period of time.
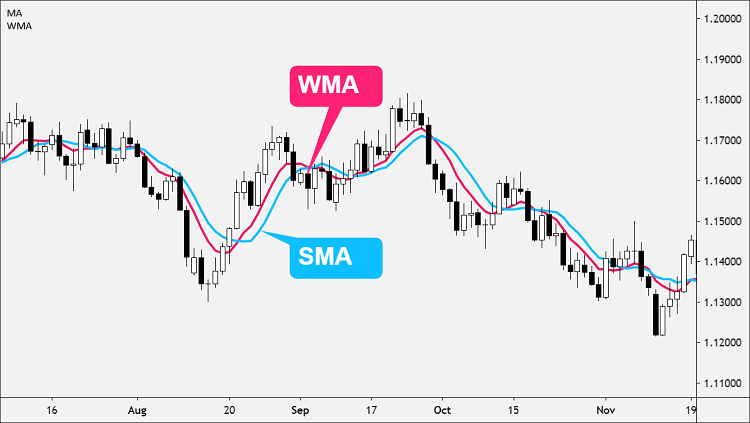
Because of its unique calculation, WMA will follow prices more closely than a Simple Moving Average (SMA).
A Weighted Moving Average (WMA) also puts greater importance on recent data than the Exponential Moving Average (EMA) by assigning values that are linearly weighted to ensure that the most recent prices have a greater impact on the average than older prices.
This means that the oldest rate included in the calculation receives a weighting of 1; the next oldest value receives a weighting of 2; and the next oldest value receives a weighting of 3, and so forth, all the way up to the most recent rate.
For example, if on:
- Day 1, the price = 100
- Day 2 = 102
- Day 3 = 105
- Day4 = 104
- And the current Day 5 = 110
The denominator would be 1+2+3+4+5 = 15
And the 5-Day WMA would be: 100*(1/15) + 102*(2/15) + 105(3/15) + 104*(4/15) + 110*(5/15) = 105.7
Some traders find this method more relevant for determining the trend direction, especially in a fast-moving market.
The downside to using WMA is that it may be “choppier” than a Simple Moving Average (SMA), which could make it more difficult to recognize a genuine trend from a random price fluctuation which would result in a false trade signal.
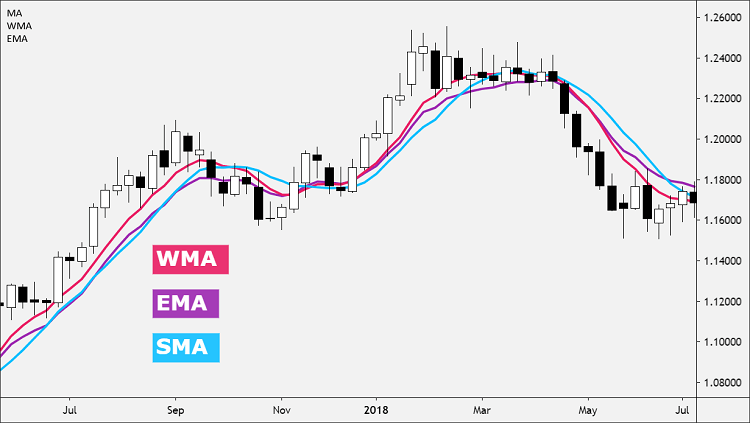
For this reason, some traders place both a Simple Moving Average (SMA) and a Weighted Moving Average (WMA) on the same price chart.
How to Use?
All moving averages, including the Weighted Moving Average (WMA), is not designed to identify a trade at the exact top or bottom.
Moving averages tend to validate that your trade is in the general direction of the trend, but with a delay at entry and exit.
Here’s how to use the WMA in your trading:
The WMA can help determine trend direction.
- If the price is in an uptrend and trading above a rising WMA, go long when prices dip near or just below the WMA.
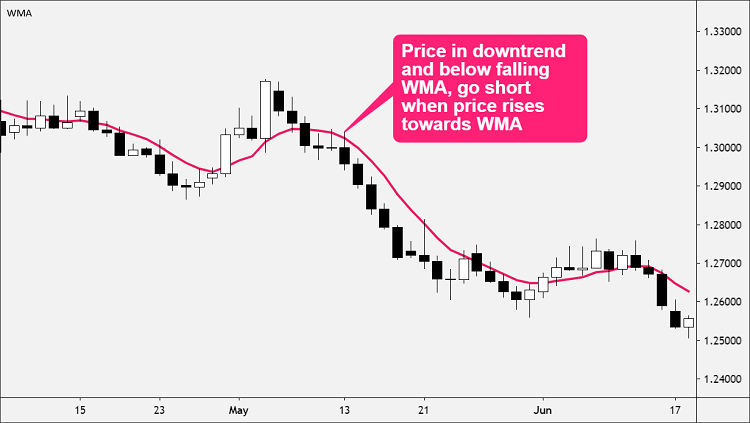
- If the price is in a downtrend and trading below a falling WMA, go short when prices rally towards or just above the WMA.
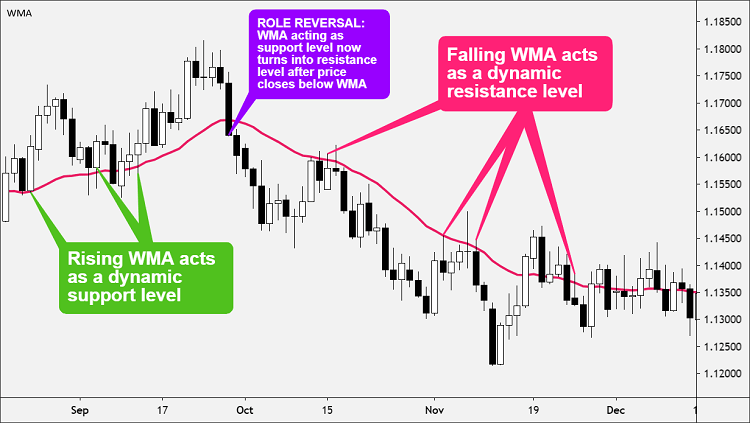
The WMA can indicate support and resistance areas.
- A rising WMA tends to support the price action.
- A falling WMA tends to provide resistance to price action.
This strategy reinforces the idea of buying when the price is near the rising WMA or selling when the price is near the falling WMA.
WMA vs. SMA
When using WMA, the same rules apply as when using the SMA.
Since the WMA has a shorter delay than the SMA, the WMA is generally more sensitive to price movement.
This can be good and bad.
It’s good because the WMA can identify trends sooner than the SMA.
It’s bad because the WMA will probably experience more whipsaws than the SMA.
Calculate WMA
The Weighted Moving Average (WMA) places more emphasis on recent prices than on older prices.
Each period’s data is multiplied by a weight, with the weighting determined by the number of periods selected.
The weighting factor used to calculate the WMA is determined by the period selected for the indicator.
For example, a 5 period WMA would be calculated as follows:
WMA = (P1 * 5) + (P2 * 4) + (P3 * 3) + (P4 * 2) + (P5 * 1) / (5 + 4+ 3 + 2 + 1)
Where:
P1 = current price
P2 = price one bar ago, and so forth…
You can customize the weighted moving average more than the SMA and EMA.
The most recent price points are usually given more weight, but it could also work the other way, where you give historical prices more weight.
If this article seems useful to your then please click the like button below. You can also share your valuable feedback or ask questions in the below comment section. Also, subscribe to our newsletter for trading-related updates.


