


")

GOLD Technical Analysis For May 26, 2025 – We have seen multiple fundamental events that trigger precious metals movements starting this year. The gold price soared from 2600 to 3500 within a few months after Donald Trump took office as the president of the United States.
Tariff, Tariff, and Tariff played a vital role during this time, and still, the situation is not normal as the US President’s threats continue. Based on the H4 Technical charts, we have found multiple trading opportunities. Let’s take a look!
Chart Analysis
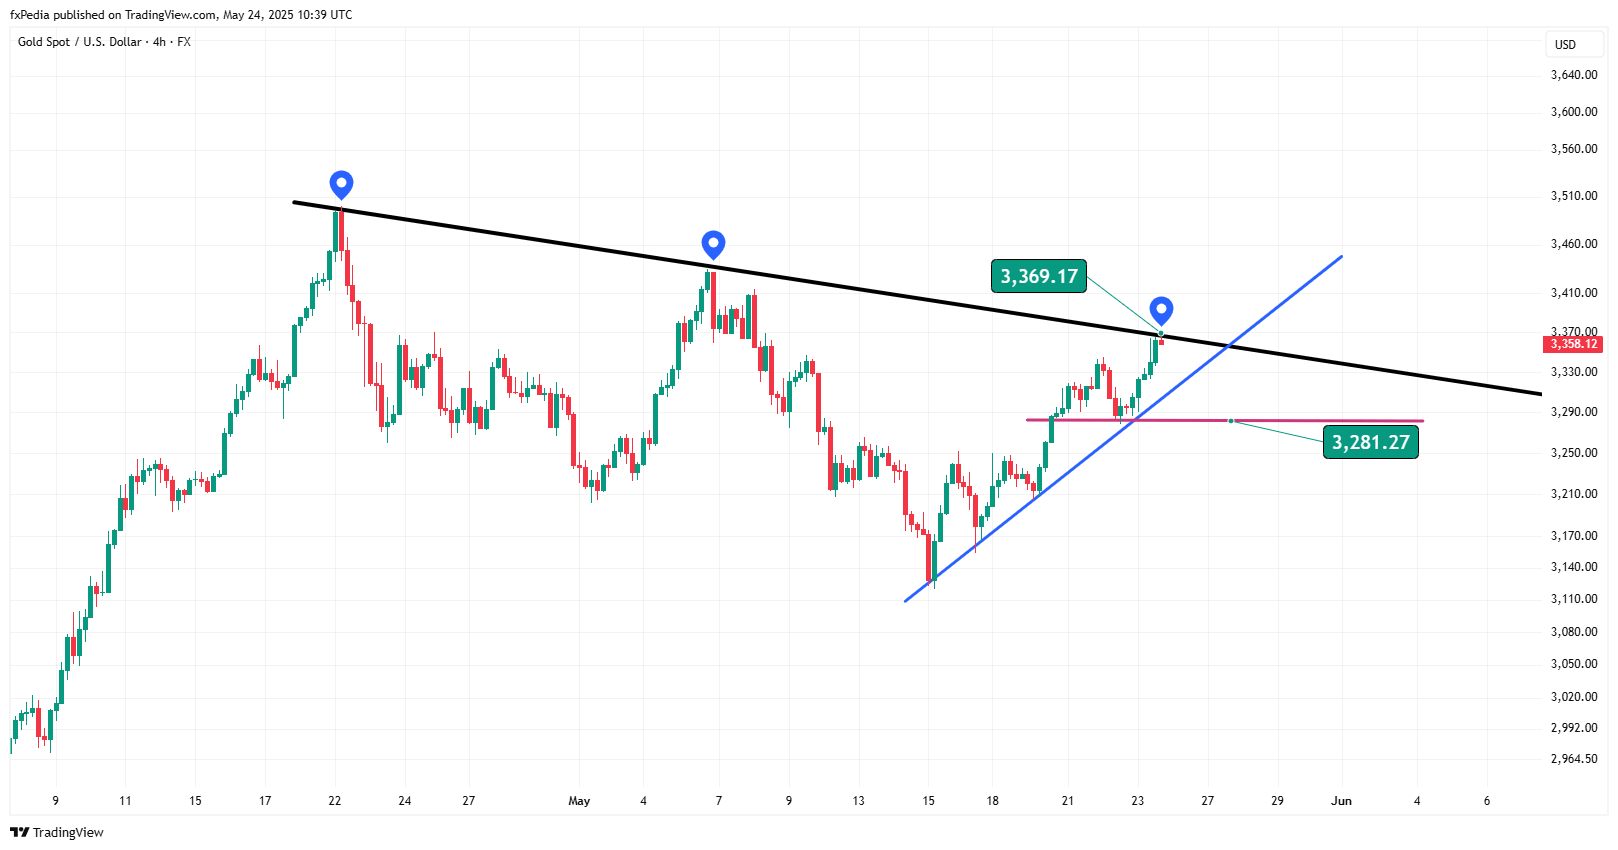
Black Colored Trendline: The gold price is close to this trendline, which acts as a resistance level. We have seen multiple price reactions in the past that make it a strong barrier for the next bullish movement. Price can push below this level again, and also can break out, which we do not know yet.
Blue Colored Trendline: It shows a higher high candlestick formation that indicates an uptrend is going on, and the price can move further.
Red Colored Trendline: Indicates the recent lowest price level of this asset, and it acts as a short-term support area.
Trading Advice:
Based on these technical Charts, we believe that the price can push further, but first, the price needs to break this trendline (Black) and hold above it. So we recommend placing a stop buy order above 3370 with a stop loss of 3337.
Or you can wait for a pullback near the trendline (Blue) and then place a buy order. But make sure to close this entry if the price breaks this trendline. We stay on the bullish side until the price is above the blue colored trendline.
Good Luck!


