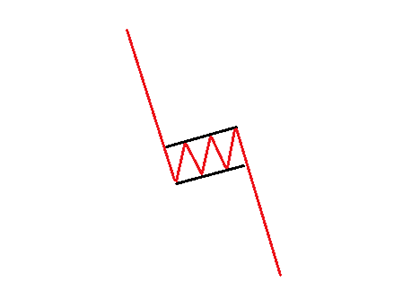
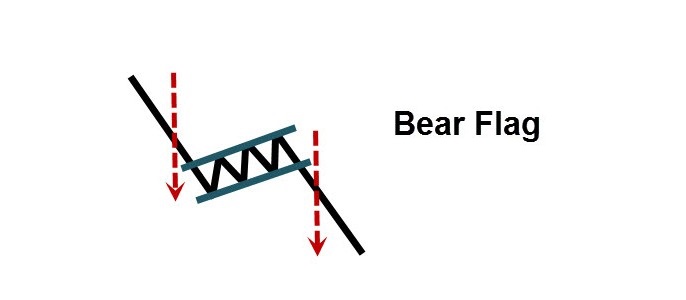
A bear flag is a bearish chart pattern that’s formed by two declines separated by a brief consolidating retracement period.
The flagpole forms on an almost vertical panic price drop as bulls get blindsided from the sellers, then a bounce that has parallel upper and lower trendlines, which form the flag.
The initial sell-off comes to an end through some profit-taking and forms a tight range making slightly higher lows and higher highs.

This illustrates that there is still selling pressure present although traders are also entering long positions looking for a reversal and this forces price to drift in an upwards direction.
During the consolidation, traders should be prepared to take action should price break down through the lower range level and/or make a new low as this indicates the bears are in control again to force another sell-off.
When the lower trendline breaks, it triggers panic sellers as the downtrend resumes another leg down
The success of a bear flag can be greater after a significant downside move due to the possible increase of overhead resistance.
Bear flags can be stronger when the swing low that begins the pattern is also an all-time low due to the possible lack of underlying support.
The bull flag is an upside-down version of the bear flag.
If this article seems useful to your then please click the like button below. You can also share your valuable feedback or ask questions in the below comment section. Also, subscribe to our newsletter for trading-related updates.


