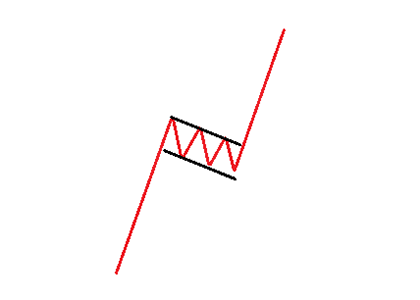
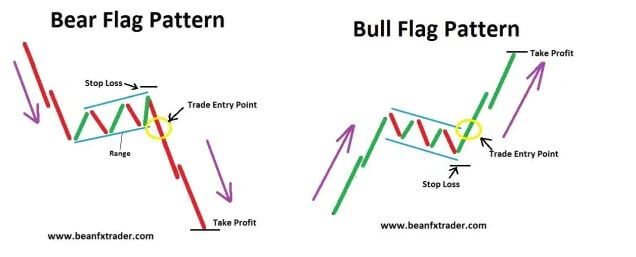
A Flag Pattern is a continuation chart pattern, named due to its similarity to a flag on a flagpole.
Although it is less popular than triangles and wedges, traders consider flags to be extremely reliable chart patterns.
A flag is a relatively rapid chart formation that appears as a small channel after a steep trend, which develops in the opposite direction.
After an uptrend, it has a downward slope. After a downtrend, it has an upward slope.
The preceding trend is crucial for pattern formation.
A “flag” is composed of an explosive strong price move forming a nearly vertical line.
This is known as the ”flagpole”.

After the flagpole forms, bearish (bullish) traders, eager to capitalize on instant profits, begin selling (buying) off their holdings.
However, this doesn’t cause a rapid decline (increase) in price, as bullish (bearish) traders, begin buying, hoping to capitalize on future increases (decreases) in price.
The resulting descending (ascending) trend channel resembles a downward-sloping (upward-sloping) parallelogram, giving the chart the appearance of a flag, and hence its name.
When the trend line resistance on the flag breaks, it triggers the next leg of the trend move, and the price proceeds ahead.
What separates the flag from a typical breakout or breakdown is the pole formation representing almost a vertical and parabolic initial price move.
Flag patterns can be bullish or bearish:
Breakouts happen in both directions but almost all flags are continuation patterns.
This means that Flags in an uptrend are expected to break out upward and Flags in a downtrend, are expected to break out downward.
If this article seems useful to your then please click the like button below. You can also share your valuable feedback or ask questions in the below comment section. Also, subscribe to our newsletter for trading-related updates.


