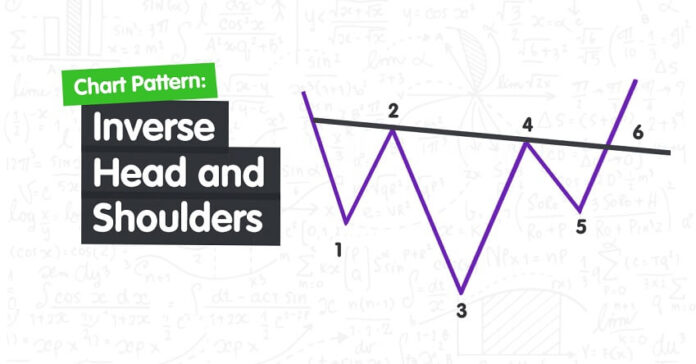
An Inverse Head and Shoulders also called a “Head and Shoulders Bottom”, is a reversal chart pattern.
It is similar to the standard Head and Shoulders pattern, except that it is inverted.
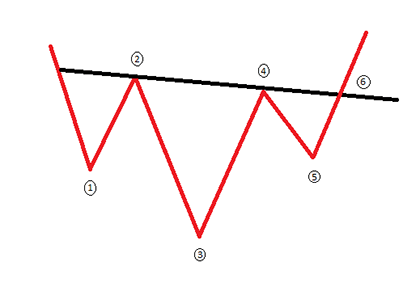
The pattern contains three successive lows with the middle-low (“head”) being the deepest and the two outside lows (“shoulders”) being shallower.
Ideally, the two shoulders would be equal in height and width
An Inverse Head and Shoulders pattern, upon completion, signals a bullish trend reversal.
Traders typically enter into a long position when the price rises above the resistance of the neckline.

The pattern begins with a downtrend with two lower lows (1 & 3) and two lower highs (2 & 4) which form the first and second bottom.
Point 5 makes a higher low which is higher than both points 3 and 1 and this forms the third bottom.
This illustrates that the downward trend is coming to an end although the reversal is confirmed when the price pushes up through the neckline at point 6 moving up pass the previous high at point 4.
The pattern is confirmed once the price breaches the neckline resistance and continues higher (2 & 4).
It is also worth observing whether the descent into point 3 is less steep than into point 1 and whether the descent into point 5 is less steep than point 3.
If this does happen, it displays how the bears are becoming less aggressive and the downward momentum is running out of steam adding to the probability of a reversal.
When a Head and Shoulders formation is seen in a downtrend, it signifies a major reversal.
Just like in the straight Head and Shoulders pattern, the strength of this reversal, measured as the rising amount after the breakout, is proportional to the decline before the pattern appears.
Stronger preceding trends are prone to more dramatic reversals.
Volume trends are exactly the same as in Head and Shoulders, where it is usually the highest at the left and trending downward.
If this article seems useful to your then please click the like button below. You can also share your valuable feedback or ask questions in the below comment section. Also, subscribe to our newsletter for trading-related updates.


