Intro
The Parabolic SAR, or Parabolic Stop and Reverse, is a trailing stop-based trading system and is often used as a technical indicator as well.
As a technical indicator, Parabolic SAR is known as a momentum indicator and used to identify potential trend reversals when the price is in a strong uptrend or downtrend.
A reversal can be an uptrend changing into a downtrend, or a downtrend changing into an uptrend.
Being able to properly utilize the Parabolic SAR allows a trader to determine the direction of the trend, provide suitable entry and exit points, and where to place trailing stops.
J. Welles Wilder, Jr. introduced Parabolic SAR in his book, New Concepts in Technical Trading Systems.
In the book, Wilder wrote about the “Parabolic Time/Price System.” SAR stands for “Stop and Reverse,” which is the actual indicator used in the system.
Wilder created the Parabolic SAR with three primary functions:
- To highlight the current trend.
- To attempt to forecast a reversal in the prevailing trend.
- To provide potential exit and entry signals during a reversal.
This book also includes the Relative Strength Index, Average True Range, and Average Directional Movement.
The Parabolic SAR is an unconventional oscillator.
Like the other oscillators, it attempts to establish whether a currency pair is overbought or oversold. However, it doesn’t use your typical standardized 0-100 scale. Instead, it displays a series of strategically placed “dots“.
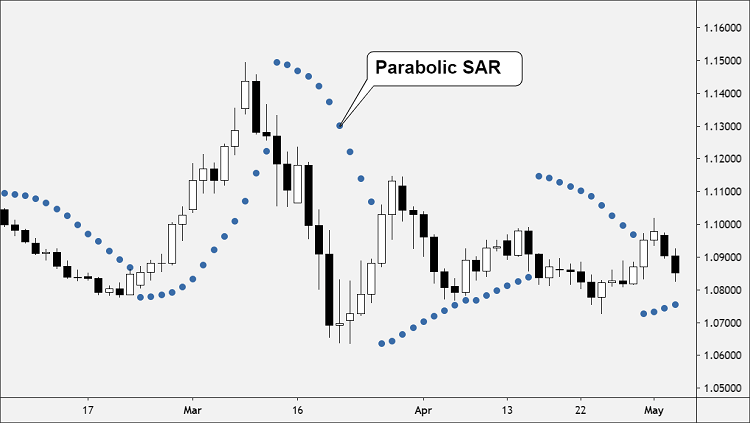
Parabolic SAR displays a series of dots that are placed either above or below the price, depending on the trend.

If the dot switches its placement, a signal is generated that the current trend is most likely coming to an end, thus giving us a hint to close any open positions.
The Parabolic SAR uses a trailing stop level that follows prices as they move up or down.
The stop level increases speed based on an “Acceleration Factor.”
When plotted on the chart, this stop level resembles a parabolic curve, which gives the indicator its name.
The parabolic function accepts three parameters.
The first two control the acceleration during up and down moves. And the last parameter determines the maximum acceleration.
The Parabolic SAR assumes that you are trading a trend and, therefore, expects the price to change over time.
If you are long, the Parabolic SAR will move the stop upward every period, regardless of whether the price has moved.
If you are short, the Parabolic SAR will move the stop downward every period, regardless of whether the price has moved.
How to Use?
You can use Parabolic SAR as a momentum indicator or as a trading system.
How to use Parabolic SAR as an indicator
The Parabolic SAR is a “chart overlay” indicator.
Unlike technical indicators like RSI, Stochastic, and MACD which are plotted as oscillating lines in a separate panel below (or above) the price chart, the Parabolic SAR is overlayed on top of the price chart and plotted as dots.
On a price chart, the Parabolic SAR appears as a series of dots placed either above or below the price, depending on the direction the price is moving.
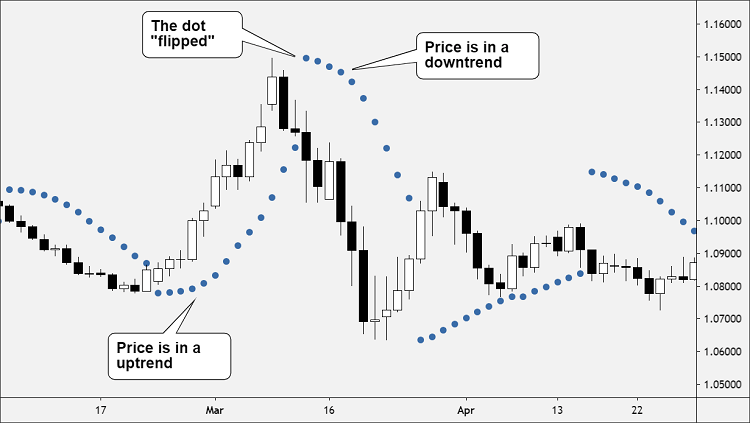
- A dot is placed below the price when it is trending upward, and above the price when it is trending downward.
- A dot below the price implies that buyers are in control and there is bullish momentum.
- A dot above the price implies that sellers are in control and there is bearish momentum.
When the dots flip, this indicates that a potential change in price direction is underway.
For example, if the dots are above the price, when they flip below the price, it indicates that the price could rise higher.
As the price rises, the dots will rise as well.
At first, the price will rise slowly but then will pick up speed and accelerate with the trend.
The dots soon catch up to the price.
Here’s how to use the Parabolic SAR as an indicator:
- Price is an uptrend when the dots are below the price.
- Price is in a downtrend when the dots are above the price.
- When the dots flip from being above the price to below the price, a potential trend reversal could be starting.
There are two important things to keep in mind when using the parabolic SAR indicator.
- Parabolic SAR is a lagging indicator, which means it follows price action.
- Parabolic SAR is only useful when the price is in a strong trend.
Since the Parabolic SAR’s main purpose is to define the trend direction, you can combine it with a trend strength indicator, such as the Average Directional Movement Index (ADX).
You should avoid pairing the Parabolic SAR with another momentum indicator since this might give you two contradicting signals and you won’t know which to follow.
The trending nature of the Parabolic SAR makes it a useful tool when the price is trending with long swings.
The Parabolic SAR sucks though when the price is trading sideways since the short price swings don’t give you enough time to confirm a reversal.
The Parabolic SAR will give lots of false signals causing you to get whipsawed during sideways, choppy or trendless conditions.
Trading System
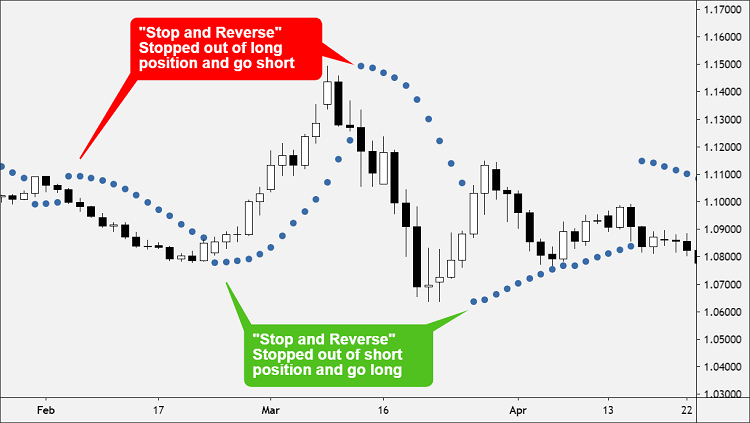
The Parabolic SAR trading system uses the parabolic level as a “Stop and Reverse” point, calculating the stop for each upcoming period.
This system keeps you in the market at all times.
The indicator is shown as a series of dots above or below the price candlesticks or bars.
The dots are the stop levels.
You should be short when the dots are above the bars.
You should be long when the dots are below the bars.
When the stop is hit, you close the current trade and initiate a new trade in the opposite direction.
Calculation
The Parabolic SAR is calculated by the recent “Extreme Price” (EP) along with an “Acceleration Factor” (AF).
The Parabolic SAR calculation depends on whether it is being applied during an uptrend or a downtrend.
Uptrend:
PSAR = Prior PSAR + Prior AF (Prior EP - Prior PSAR)
Downtrend:
PSAR = Prior PSAR - Prior AF (Prior PSAR - Prior EP)
In this calculation, EP refers to the highest high for an uptrend and lowest low for a downtrend, updated each time a new EP is reached.
The AF used by Wilder is 0.02.
So the AF is a constant of 0.02, increasing by 0.02 each time a new EP is reached, with a maximum of 0.20.
This means move the Stop 2 percent of the distance between EP and the original stop.
Each time the EP changes, the AF increases by 0.02 up to the maximum acceleration, which is 0.2 in this case.
Most trading platforms enable you to overlay the Parabolic SAR on any price chart at the click of a button.
Summary
- The Parabolic SAR is a technical indicator which traders use to attempt to forecast whether a prevailing trend will continue or reverse.
- The indicator is based on parabolic lines, which are a series of dots.
- A series of dots below the price signal that the current trend is bullish.
- A series of dots above the price signal that the current trend is bearish.
- A dot flipping above price might signal a bearish reversal
- A dot flipping below price might signal a bullish reversal.
- Avoid using Parabolic SAR in a sideways or consolidating market because it will generate a lot of false signals.
If this article seems useful to your then please click the like button below. You can also share your valuable feedback or ask questions in the below comment section. Also, subscribe to our newsletter for trading-related updates.


