


There are 3 types of charts available at Forex Trading Terminal.
- Line chart
- Bar chart
- The candlestick chart
Now we will learn how to interpret these three types of charts.
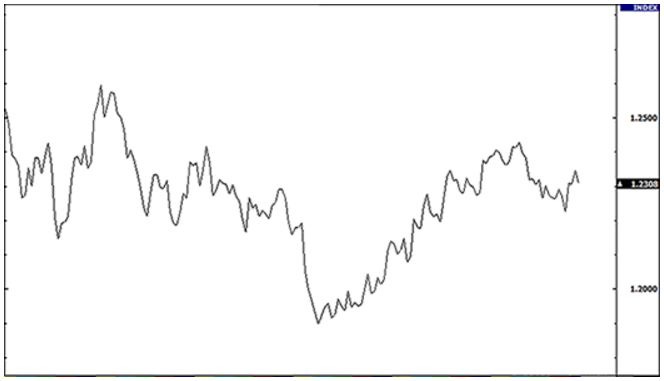
Line Chart
In this chart, a simple line from one closing price to the next closing price is added. We can see the price movement of a currency pair for a given period through this chart.
The following example is for EURUSD,
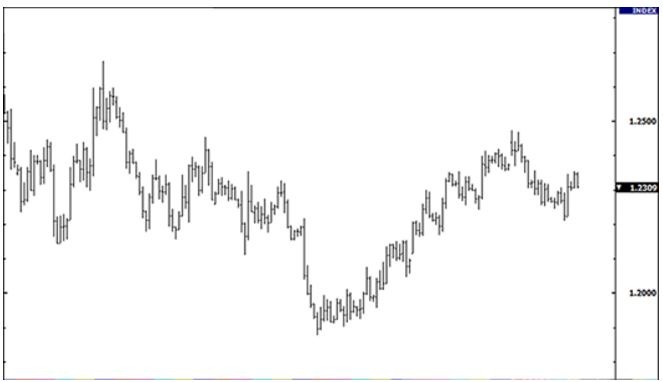
Bar Charts
The bar chart is a bit more complicated than the line chart. In this chart, you can see the Opening and Closing price along with the Highs and Lows. The lower part of the vertical bar gives you the lowest price for that period, while the upper part indicates the highest price for that period. The vertical bar itself indicates the specific price range for that time.
The following example is for EURUSD,
NB: We’ve mentioned the word “bar” many times here. The bar here is the only part of a chart.
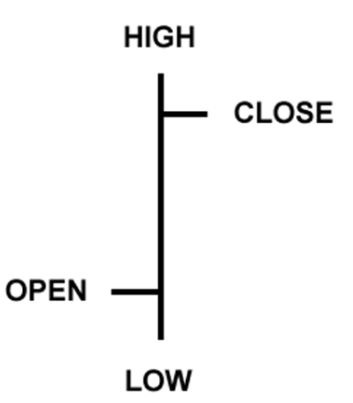
The horizontal hash (bottom or side hash) is the opening price and the top right hash indicates the closing price.
Many times the bar chart is also called “OHLC” chart, because it shows Open, Close, High and Low together. In the chart,
Open = Bottom or bottom line
Close = Top right-hand line
High = top of the vertical line
Low = the bottom of the vertical line
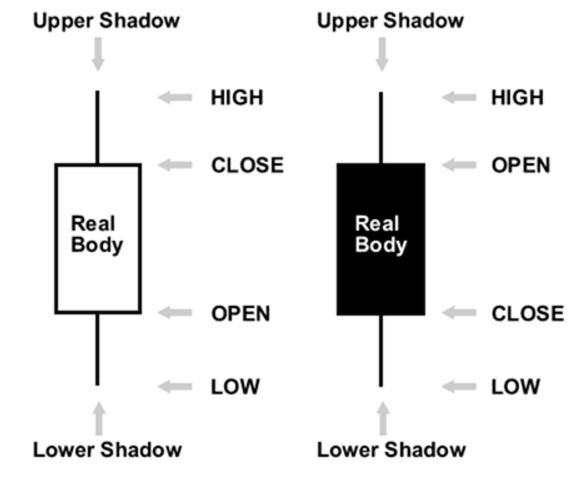
Candlesticks Charts
The candlestick chart also looks like a bar chart to show everything in the market price, but it is nice to see from the bar chart and better understand the market position.
If this article seems useful to your then please click the like button below. You can also share your valuable feedback or ask questions in the below comment section. Also, subscribe to our newsletter for trading-related updates.


