


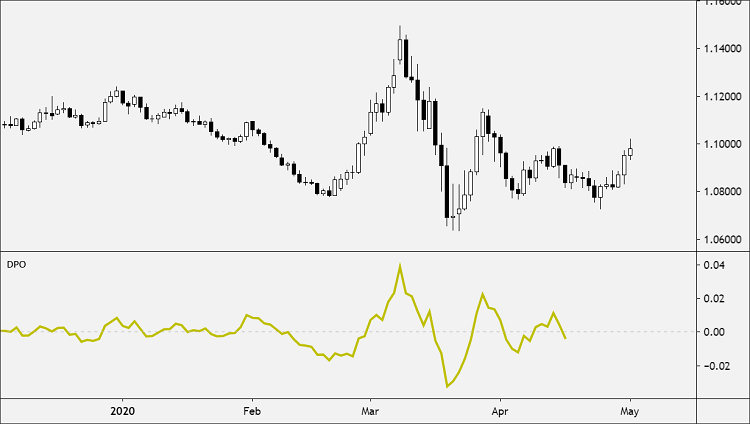
The Detrended Price Oscillator (DPO) attempts to remove trend from price to make it easier for traders to identify price cycles with their peaks and troughs
As the name indicates, DPO is a technical indicator designed to give information about the price of an asset without taking into account existing price trends.
Cycles longer than the period specified for the indicator are removed, leaving only the shorter-term cycles.
DPO is displaced to the left so that the indicator is aligned with the peaks and troughs in price.
The logic behind this is that detrended prices can help traders to understand the buying and selling pressure based on short-term fluctuations in the price of an asset, without taking into account larger upswings or downswings in price.
Usage
The Detrended Price Oscillator (DPO)is used to identify cycles with its peaks and troughs.
Cycles can be estimated by counting the periods between peaks or troughs.
Users can experiment with shorter and longer DPO settings to find the best fit.
One of the fundamental assumptions of the DPO is that long-term price trends are composed of short-term price trends and that only by looking at short-term trends can long-term trends be understood.
Severe peaks and troughs in the DPO indicate potential reversals in the overall trend.
Calculation
In order to calculate the Detrended Price Oscillator, you need to establish g a period of time that could be said to indicate a trend in price.
For example, if prices steadily increase over a twenty-day period, then you would use “20” as the period of time that indicates a trend.
Divide this period by two and add one to arrive at a number n.
Then take the moving average of an asset’s price n days before the period in question, and subtract this from the asset’s closing price for that period.
The resulting number is the period’s DPO.
This calculation method ensures that although short-term price trends are included in a DPO chart, longer-term trends are excluded.
DPO = Close (n/2 + 1 Periods ago) – n Period SMA
If this article seems useful to your then please click the like button below. You can also share your valuable feedback or ask questions in the below comment section. Also, subscribe to our newsletter for trading-related updates.


