


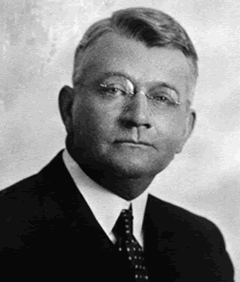
Ralph Nelson Elliott
Back in the old school days of the 1920-30s, there was this mad genius and professional accountant named Ralph Nelson Elliott.
By analyzing closely 75 years’ worth of stock data, Elliott discovered that stock markets, thought to behave in a somewhat chaotic manner, actually didn’t.
When he hit 66 years old, he finally gathered enough evidence (and confidence) to share his discovery with the world.
He published his theory in the book entitled The Wave Principle.
According to him, the market traded in repetitive cycles, which he pointed out were the emotions of investors caused by outside influences (ahem, CNBC, Bloomberg, WSB) or the predominant psychology of the masses at the time.
Elliott explained that the upward and downward swings in price caused by collective psychology always showed up in the same repetitive patterns.
He called these upward and downward swings “waves”.
He believes that, if you can correctly identify the repeating patterns in prices, you can predict where the price will go (or not go) next.
This is what makes Elliott waves so appealing to traders.
It gives them a way to identify precise points where the price is most likely to reverse.
In other words, Elliott came up with a system that enables traders to catch tops and bottoms.
So, amidst all the chaos in prices, Elliott found order. Awesome, huh?
Of course, like all mad geniuses, he needed to claim this observation and so he came up with a super original name: The Elliott Wave Theory.
But before we delve into the Elliott waves, you need to first understand what fractals are.
Fractals
Basically, fractals are structures that can be split into parts, each of which is a very similar copy of the whole. Mathematicians like to call this property “self-similarity”.
You don’t need to go far to find examples of fractals. They can found all over nature!

A seashell is a fractal. A snowflake is a fractal. A cloud is a fractal. Heck, a lightning bolt is a fractal.
So why are fractals important?
One important quality of Elliott waves is that they are fractals. Much like seashells and snowflakes, Elliott waves could be further subdivided into smaller Elliot waves.
Ready to be an Elliottician now? Read on!
Impulse Waves
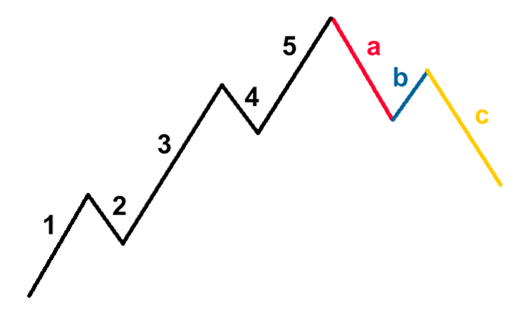
Mr. Elliott showed that a trending market moves in what he calls a 5-3 wave pattern.
The first 5-wave pattern is called impulse waves.
The last 3-wave pattern is called corrective waves.
In this pattern, Waves 1, 3, 5 are motive, meaning they go along with the overall trend, while Waves 2 and 4 are corrective.
Do not confuse Waves 2 and 4 with the ABC corrective pattern (discussed in the next lesson) though!
Let’s first take a look at the 5-wave impulse pattern. It’s easier if you see it as a picture:
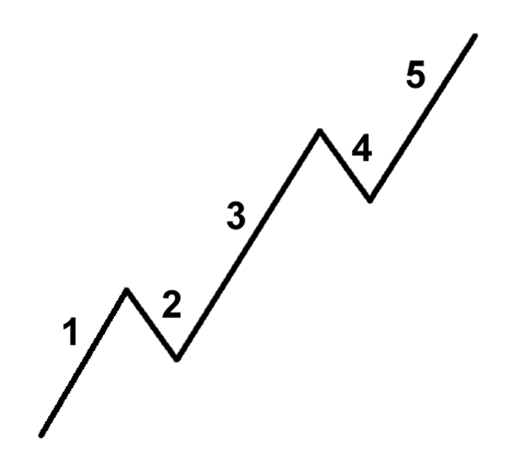
That still looks kind of confusing. Let’s splash some color on this bad boy.
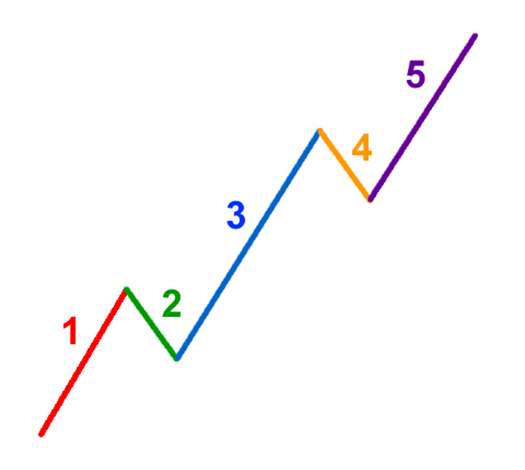
Ah, magnifico! It’s so pretty! We like colors, so we’ve color-coded each wave along with its wave count.
Here is a short description of what happens during each wave.
We’re going to use stocks for our example since stocks are what Mr. Elliott used but it really doesn’t matter what it is. It can easily be currencies, bonds, gold, oil, or Tickle Me Elmo dolls.
The important thing is the Elliott Wave Theory can also be applied to the foreign exchange market.
Wave 1
The stock makes its initial move upwards.
This is usually caused by a relatively small number of people that all of the sudden (for a variety of reasons, real or imagined) feel that the price of the stock is cheap so it’s a perfect time to buy. This causes the price to rise.
Wave 2
At this point, enough people who were in the original wave consider the stock overvalued and take profits.
This causes the stock to go down. However, the stock will not make it to its previous lows before the stock is considered a bargain again.
Wave 3
This is usually the longest and strongest wave. The stock has caught the attention of the mass public.
More people find out about the stock and want to buy it. This causes the stock’s price to go higher and higher. This wave usually exceeds the high created at the end of wave 1.
Wave 4
Traders take profits because the stock is considered expensive again.
This wave tends to be weak because there are usually more people that are still bullish on the stock and are waiting to “buy on the dips.”
Wave 5
This is the point that most people get on the stock and is most driven by hysteria.
You usually start seeing the CEO of the company on the front page of major magazines as the Person of the Year.
Traders and investors start coming up with ridiculous reasons to buy the stock and try to choke you when you disagree with them.
This is when the stock becomes the most overpriced. Contrarians start shorting the stock which starts the ABC pattern.
Extended Impulse Waves
One thing that you also need to know about the Elliott Wave Theory is that one of the three impulse waves (1, 3, or 5) will always be “extended.”
Simply put, there will always be one wave that is longer than the other two, regardless of degree.
According to Elliott, it is usually the fifth wave that is extended.
As time went by, this old school style of wave labeling has changed because more and more people started labeling the third wave as the extended one.
Corrective Waves
The 5-wave trends are then corrected and reversed by 3-wave countertrends.
Letters are used instead of numbers to track the correction.
Check out this example of a smokin’ hot corrective 3-wave pattern!
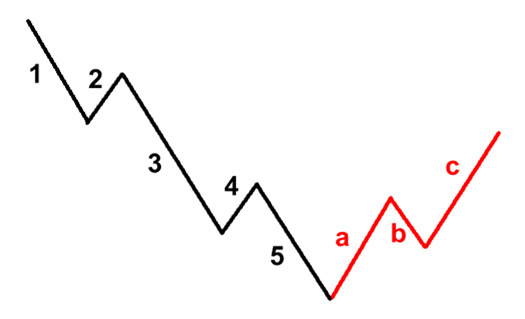
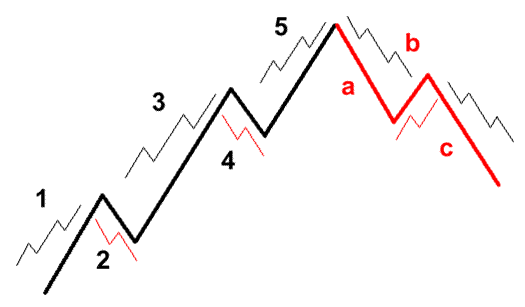
Just because we’ve been using a bull market as my primary example doesn’t mean the Elliott Wave Theory doesn’t work on bear markets.
The same 5-3 wave pattern can look like this:
Types of Corrective Wave Patterns
According to Elliott, there are 21 corrective ABC patterns ranging from simple to complex.
“Uh, 21? I can’t memorize all of that! The basics of the Elliott Wave Theory are already mind-blowing!”
Take it easy, young padawan. The great thing about Elliott Wave is you don’t have to be above the legal drinking age to trade it!
You don’t have to get a fake ID or memorize all 21 types of corrective ABC patterns because they are just made up of three very simple easy-to-understand formations.
Let’s take a look at these three formations. The examples below apply to uptrends, but you can just invert them if you’re dealing with a downtrend.
The Zig-Zag Formation
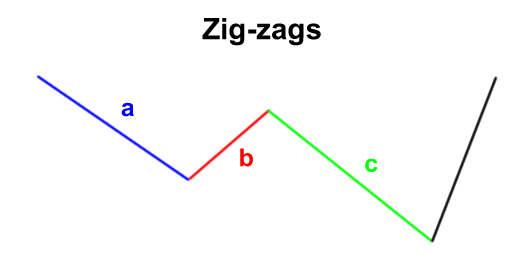
Zig-zag formations are very steep moves in price that go against the predominant trend.
Wave B is typically the shortest in length compared to Waves A and C.
These zig-zag patterns can happen twice or even thrice in a correction (2 to 3 zig-zag patterns linked together).
Like with all waves, each of the waves in zig-zag patterns could be broken up into 5-wave patterns.
The Flat Formation
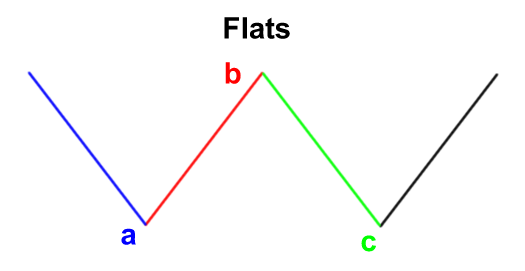
Flat formations are simple sideways corrective waves.
In flats, the lengths of the waves are GENERALLY equal in length, with wave B reversing wave A’s move and wave C undoing wave B’s move.
We say generally because wave B can sometimes go beyond the beginning of wave A.
The Triangle Formation
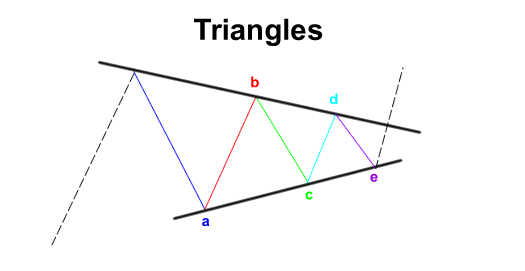
Triangle formations are corrective patterns that are bound by either converging or diverging trend lines.
Triangles are made up of 5-waves that move against the trend in a sideways fashion. These triangles can be symmetrical, descending, ascending, or expanding.
Fractals: Elliott Waves Within an Elliott Wave
Like we mentioned earlier, Elliott waves are fractals.
Each wave is made of sub-waves. Huh?
Let me show you another picture. Pictures are great, aren’t they? Yee-haw!
Do you see how Waves 1, 3, and 5 are made up of a smaller 5-wave impulse pattern while Waves 2 and 4 are made up of smaller 3-wave corrective patterns?
You’re seeing fractals!
Always remember that each wave is comprised of smaller wave patterns.
This pattern repeats itself…
FOREVER!
To make it easy to label these waves, the Elliott Wave Theory has assigned a series of categories to the waves in order of the largest to the smallest. They are:
- Grand Supercycle (multi-century)
- Supercycle (about 40–70 years)
- Cycle (one year to several years)
- Primary (a few months to a couple of years)
- Intermediate (weeks to months)
- Minor (weeks)
- Minute (days)
- Minuette (hours)
- Sub-Minuette (minutes)
A Grand Supercycle is made up of Supercycle waves which are made up of Cycle waves which are made up Primary waves, which is made up of Intermediate waves which are made up of Minor waves which are made up of Minute waves which are made up of Minuette waves which are made up of Sub-Minuette waves. Did you get all that?
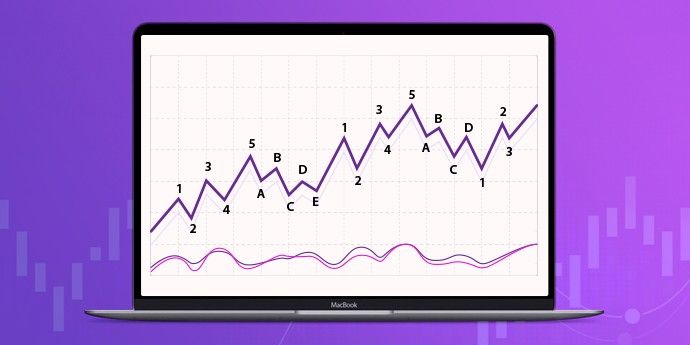
Okay, to make things much clearer, let’s see how an Elliott Wave looks in real life.
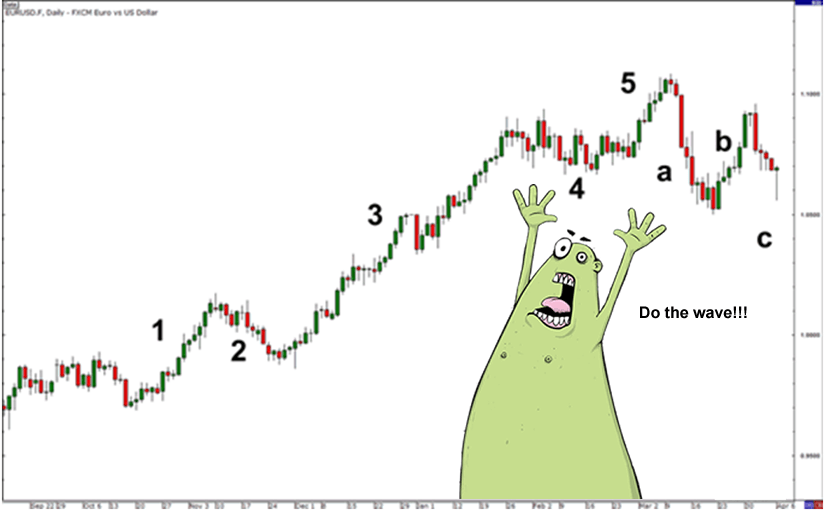
As you can see, waves aren’t shaped perfectly in real life.
You’ll also learn it’s sometimes difficult to label waves.
But the more you stare at charts the better you’ll get.
Besides, we’re not going to let you go at it alone!
In the following sections, we’ll give you some tips on how to correctly and easily identify waves as well as teach you how to trade using Elliott Waves. Surf’s up!
Rules of the Wave Theory
As you may have guessed, the key to using the Elliott Wave Theory in trading is all about being able to correctly identify waves.
By developing the right eye in recognizing what wave the market is in, you will be able to find out which side of the market to trade on, long or short.
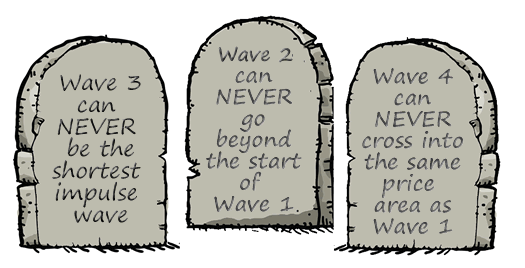
There are THREE cardinal “cannot-be-broken” rules in labeling waves.
So, before you jump right into applying the Elliott Wave Theory to your trading, you must take note of the rules below.
Failing to label waves correctly can prove disastrous to your account.
Rule Number #1: Wave 3 can NEVER be the shortest impulse wave
Rule Number #2: Wave 2 can NEVER go beyond the start of Wave 1
Rule Number #3: Wave 4 can NEVER cross in the same price area as Wave 1
Trading Guidelines
Then, there are guidelines that help you correctly label waves.
Unlike the three cardinal rules, these guidelines can be broken. Here they are:
Sometimes, Wave 5 does not move beyond the end of wave 3. This is called truncation.
Wave 5, more often than not, goes beyond or “breaks through” the trend line drawn off Wave 3 parallel to a trend line connecting the start of Waves 3 and 5.
Wave 3 tends to be very long, sharp, and extended.
Waves 2 and 4 frequently bounce off Fibonacci retracement levels.
Trading Systems
This is probably what you all have been waiting for – drumroll please – using the Elliott Wave Theory in forex trading!
As an Elliott Wave trader, you will be spotting “wave counts.”
This means that you will be labeling the waves to see how they conform to the Elliott Wave pattern, to try and anticipate future price movement.
In this section, we will look at some setups and apply our knowledge of Elliott Wave to determine entry, stop loss, and exit points. Surfs up!

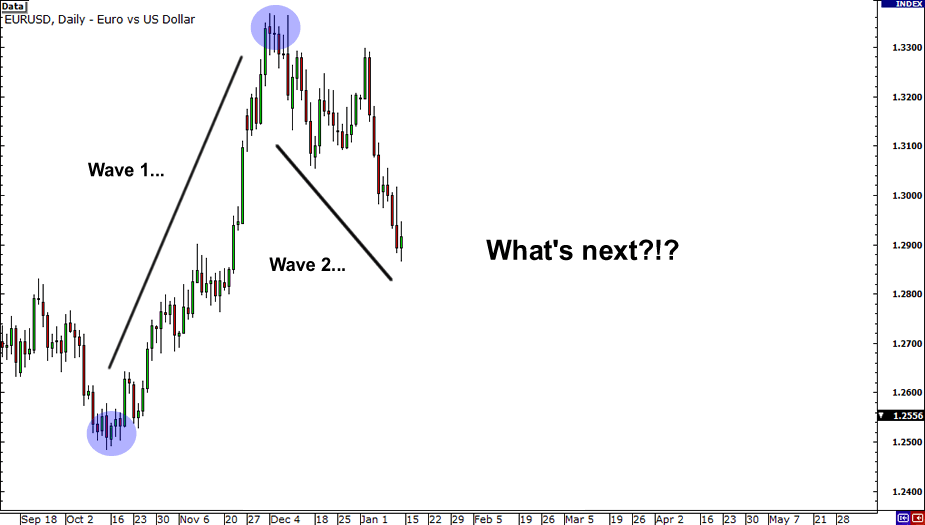
Hypothetical, will-most-probably-be-right scenario #1:
Let’s say you wanted to begin your wave count. You see that price seems to have bottomed out and has begun a new move upwards.
Using your knowledge of Elliott Wave, you label this move up as Wave 1 and the retracement as Wave 2.
In order to find a good entry point, you head back to the School of Pipsology to find out which of the three cardinal rules and guidelines you could apply. Here’s what you found out:
- Rule Number #2: Wave 2 can NEVER go beyond the start of Wave 1
- Waves 2 and 4 frequently bounce off Fibonacci retracement levels
So, using your superior Elliott Wave trading skills, you decide to pop the Fibonacci tool to see if the price is at a Fib level. Holy mama!
Price is just chillin’ like ice cream fillin’ around the 50% level. Hmm, this could be the start of Wave 3, which is a very strong buy signal.
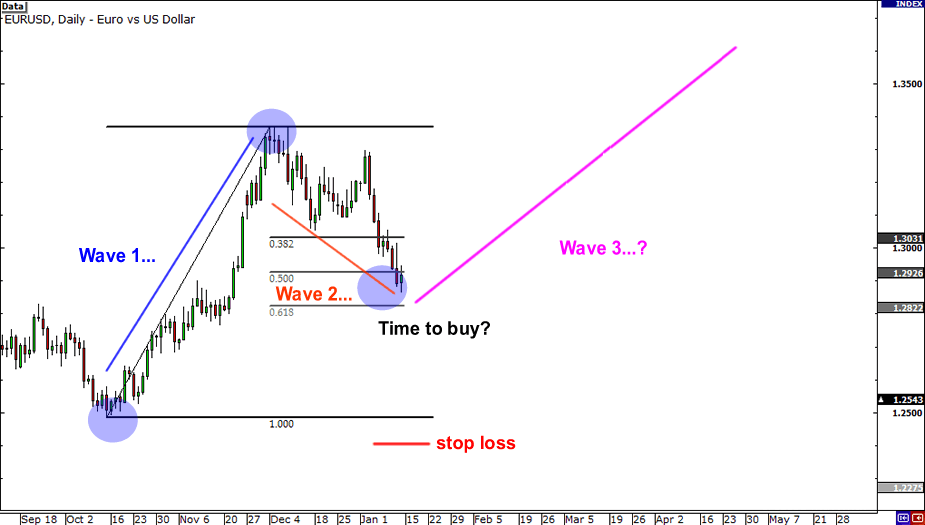
Since you’re a smart forex trader, you also take your stop into consideration.
Cardinal rule number 2 states that Wave 2 can never go beyond the start of Wave 1 so you set your stop below the former lows.
If the price retraces more than 100% of Wave 1, then your wave count is wrong.
Let’s see what happens next…
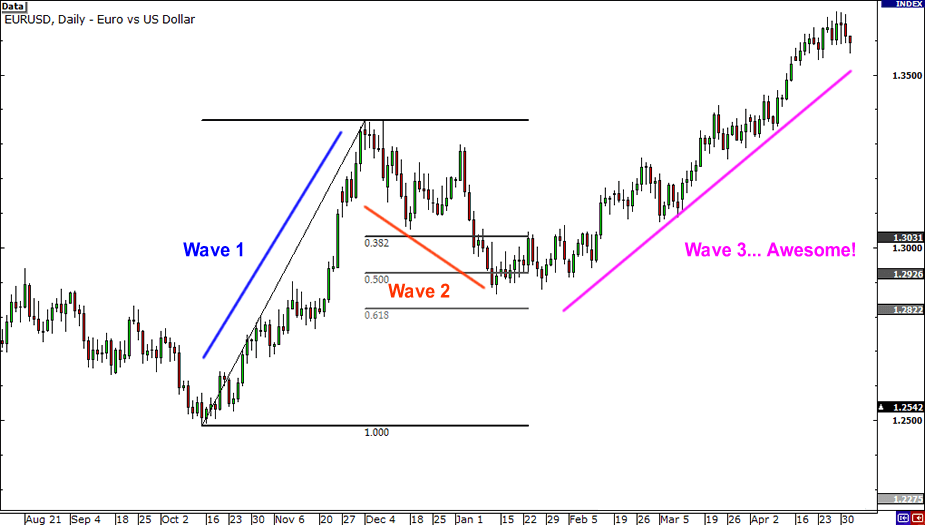
Your Elliott Wave analysis paid off and you caught a huge upward move!
You go to Las Vegas (or Macau), overconfident that everything you touch is a winner, blow all your forex profits on roulette, and end right back where you started.
There are no Elliot Waves in a casino.
Lucky for you…we have another hypothetical scenario where you can earn imaginary money again…
Scenario 2:
This time, let’s use your knowledge on corrective wave patterns to grab those pips.
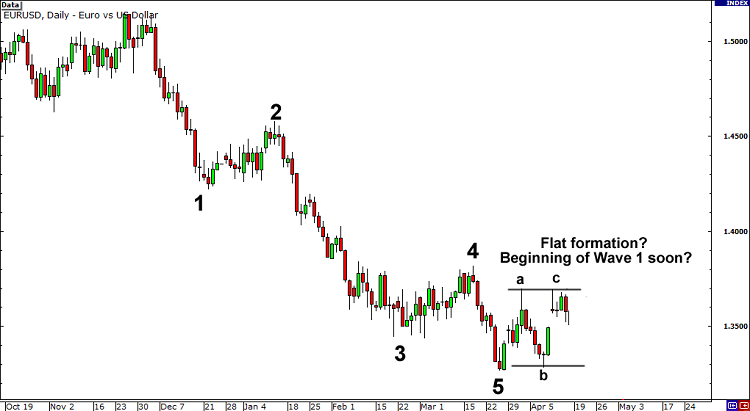
You begin counting the waves on a downtrend and you notice that the ABC corrective waves are moving sideways.
Hmm, is this a flat formation in the works? This means that price may just begin a new impulse wave once Wave C ends.
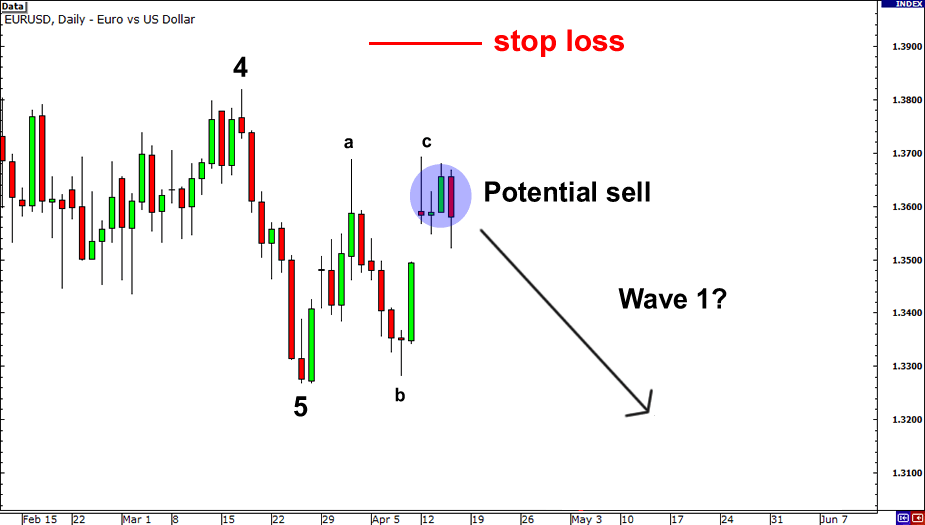
Trusting your Elliott Wave skills, you go ahead and sell at the market price in hopes of catching a new impulse wave.
You place your stop just a couple of pips above the start of Wave 4 just in case your wave count is wrong.
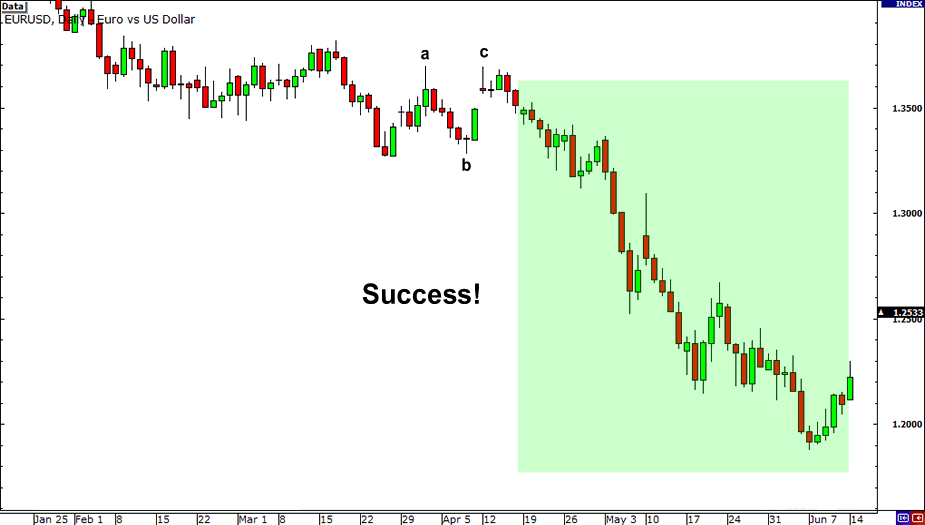
Because we like happy endings, your trade idea based on the Elliott Wave Theory works out and nets you a couple of thousand pips on this day, which is not always the case.
You have also learned your lesson this time around so you skip Vegas and decide to use your profits to grow your forex trading capital instead.
If this article seems useful to your then please click the like button below. You can also share your valuable feedback or ask questions in the below comment section. Also, subscribe to our newsletter for trading-related updates.


