


A rectangle is a chart pattern formed when the price is bounded by parallel support and resistance levels.
A rectangle exhibits a period of consolidation or indecision between buyers and sellers as they take turns throwing punches but neither has dominated.
The price will “test” the support and resistance levels several times before eventually breaking out.
From there, the price could trend in the direction of the breakout, whether it is to the upside or downside.
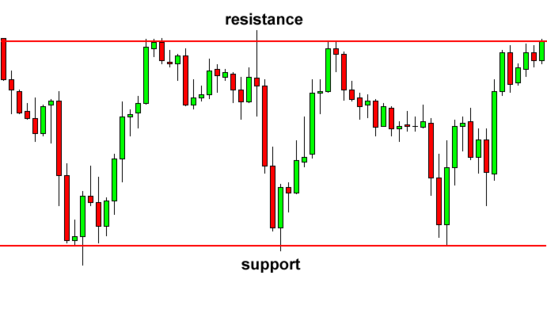
In the example above, we can clearly see that the pair was bounded by two key price levels which are parallel to one another.
We just have to wait until one of these levels breaks and goes along for the ride!
Remember, when you spot a rectangle: THINK OUTSIDE THE BOX!
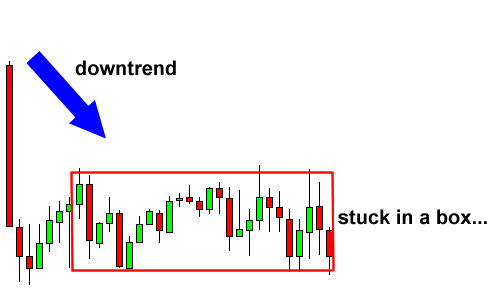
Bearish Rectangle
A bearish rectangle is formed when the price consolidates for a while during a downtrend.
This happens because sellers probably need to pause and catch their breath before taking the pair any lower.
In this example, price broke the bottom of the rectangle chart pattern and continued to shoot down.
If we had a short-order just below the support level, we would have made a nice profit on this trade.
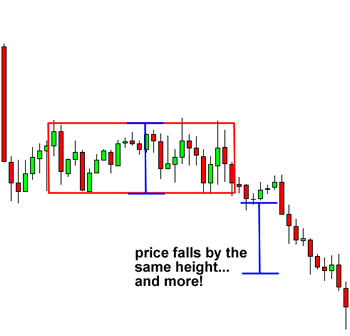
Here’s a tip: Once the pair falls below the support, it tends to make a move that is about the size of the rectangle pattern.
In the example above, the pair moved beyond the target so there would have been a chance to catch more pips!
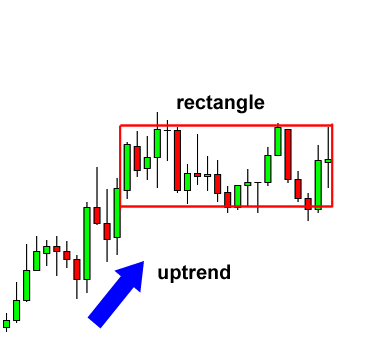
Bullish Rectangle
Here’s another example of a rectangle, this time, a bullish rectangle chart pattern.
After an uptrend, the price paused to consolidate for a bit. Can you guess where the price is headed next?
If you answered up, then you’re right! Check out that nice upside breakout right there!
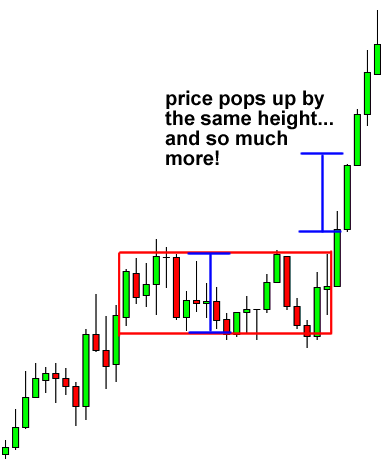
Notice how the price moved all the way up after breaking above the top of the rectangle pattern.
If we had a long order on top of the resistance level, we would’ve caught some pips on the trade!
Just like in the bearish rectangle pattern example, once the pair breaks, it will usually make a move that’s AT LEAST the size of its previous range.


