


May 5, 2021
Estimated reading time: < 1 min
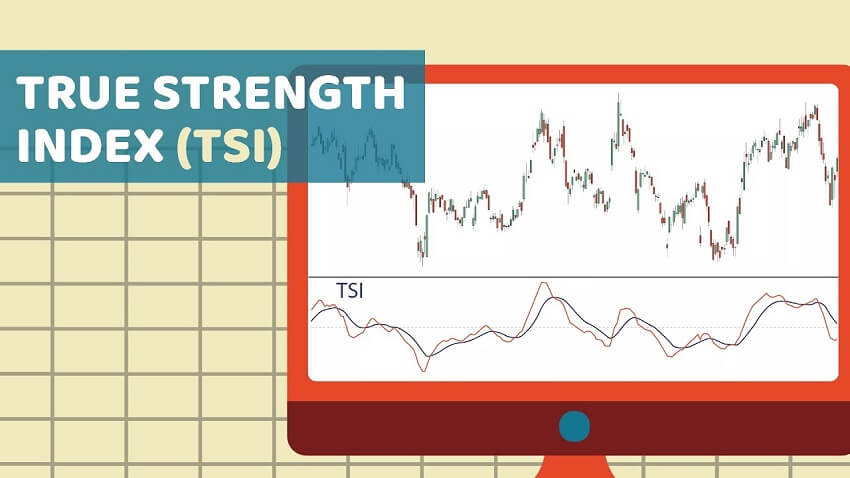
The True Strength Index (TSI) is a momentum oscillator that ranges between limits of -100 and +100 and has a base value of 0.
Momentum is positive when the oscillator is positive (pointing to a bullish market bias).
Momentum is negative when the oscillator is negative (pointing to a bearish market bias).
It was developed by William Blau and consists of 2 lines:
- The index line
- An exponential moving average of the TSI, called the signal line
Traders may look for any of the following five types of conditions:
- Overbought
- Oversold
- Centerline crossover
- Divergence
- Signal line crossover.
TSI is useful for determining overbought and oversold conditions, indicating potential trend direction changes via centerline or signal line crossovers, and warning of trend weakness through divergence.
The indicator is often used in combination with other signals.
If this article seems useful to your then please click the like button below. You can also share your valuable feedback or ask questions in the below comment section. Also, subscribe to our newsletter for trading-related updates.
Views: 31


