


The Williams %R (%R) is a technical indicator that reflects the level of the close relative to the highest high over a specific period, usually 14 days or periods.
Williams %R, also known as the Williams Percent Range, is categorized as a momentum oscillator. This means that Williams %R is used to identify overbought and oversold levels.
The Williams %R indicator was created by Larry Williams., the famed author, and stock and commodity trader.
Aside from Williams %R, Williams also created many other indicators, such as the Ultimate Oscillator, COT indices, accumulation/distribution indicators, cycle forecasts, market sentiment, and value measurements for commodity prices.
His most famous creation though is probably his daughter, Michelle Williams, the famous actress who won two Golden Globes for portraying Marilyn Monroe in the drama My Week with Marilyn.
Williams %R is similar to the Stochastic oscillator and is used in the same way.
The indicator can help traders find entry and exit points based on “overbought” and “oversold” conditions, as well as changes in bullish or bearish momentum.
How to Use?
Williams %R tells you where the current price is relative to the highest high over the last 14 periods (or whatever number of lookback periods is chosen).
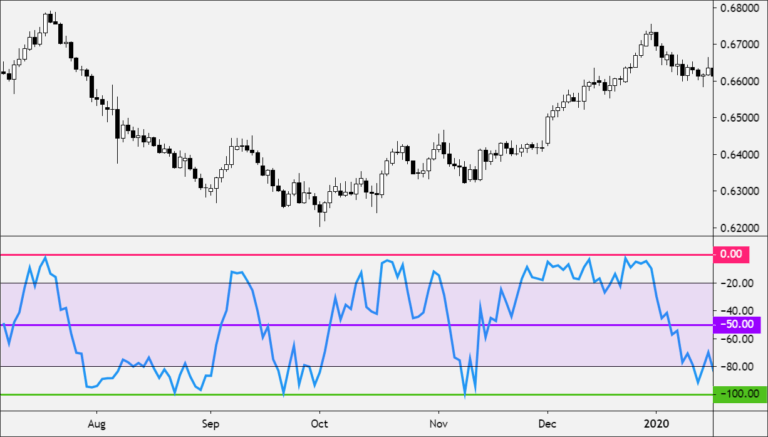
Williams %R is a bounded oscillator and moves between 0 and -100, with –50 as the midpoint.
- The closer the reading is -100, the closer the price is to the lowest low in the lookback period.
- The closer the reading is to 0, the closer the price is highest high in the lookback period.
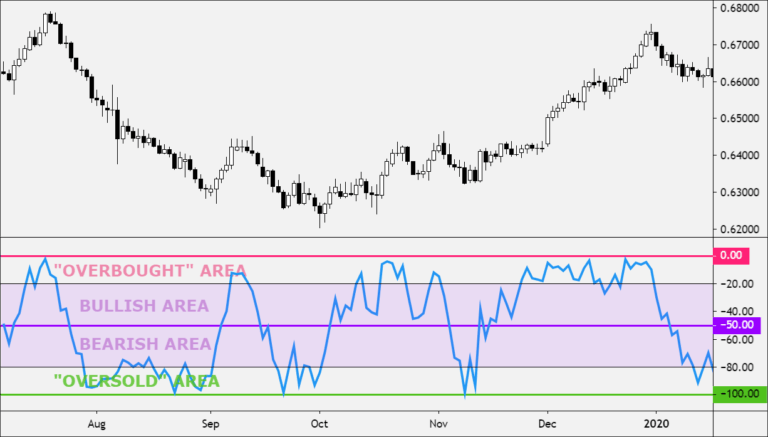
- If Williams %R crosses above -50, this signals that prices are trading in the upper half of the high-low range for the given lookback period. This is bullish.
- If Williams %R crosses below-50, this signals that prices are trading in the bottom half of the high-low range for the given lookback period. This is bearish.
The default settings for Williams %R use -20 as the overbought threshold and -80 as the oversold threshold.
The simple way to interpret the readings is as follows:
- A reading above -20 is considered overbought.
- A reading below -80 is considered oversold.
But here is the actual meaning of the readings:
- Readings above -20 for the Williams %R indicate that price is trading near the top end of its high-low range.
- Readings above -80 for the Williams %R indicate that price is trading near the low end of its high-low range.
During an uptrend, wait for Williams %R to move below -80. When the price starts rising, and the indicator moves back above -80, this signals that the uptrend may be resuming.
During a downtrend, wait for Williams %R to move above -20. When the price starts falling and the indicator moves back below -20, this signals that the downtrend may be resuming.
Watch for fading momentum.
During a strong uptrend, Williams %R will often reach -20 or higher. If the indicator falls, and then can’t rise back above -20 before falling again, this indicates that the upward price momentum is weakening and the price may now fall.
During a strong downtrend, Williams %R will often reach -80 or lower. If the indicator rises, and then can’t fall back below -80 before rising again, this indicates that the downward price momentum is weakening and the price may now rise.
Weaknesses
Here are some things to watch out for when using the Williams %R indicator:
Overbought/Oversold does not mean the trend will reverse.
Just because the Williams %R is giving an “Overbought” or “Oversold” readings does NOT guarantee a reversal will occur.
An “Overbought” reading shows that price is trading near the previous high or even making new highs, which means that the uptrend is actually STRONG.
So Williams %R can remain ”Overbought” if the price continues to trend upwards.
An “Oversold” reading shows that price is trading near the previous low or even making new lows, which means that the downtrend is STRONG.
So Williams %R can remain ”Oversold” if the price continues to trend downwards.
Always remember that even though something is overbought or oversold. it can remain like this for a long time.
How long? Long enough for you to go broke or blow your account.
Be careful of false signals.
The Williams %R indicator is also prone to false signals.
For example, 14-period Williams %R may show “Oversold” and starts to move higher, but the price stays flat or even moves lower.
This is because the indicator is only looking at the last 14 periods.
As periods go by, the current price relative to the high and low range of the lookback period changes, even if the price hasn’t moved.
Calculation
The formula used to calculate Williams’ %R:
%R = (Highest High - Close)/(Highest High - Lowest Low) * -100
Where:
Lowest Low = lowest low for the look-back period
Highest High = highest high for the look-back period
%R is multiplied by -100 correct the inversion and move the decimal.
The Williams %R is calculated based on price, typically over the last 14 periods.
- Record the high and low for each period over 14 periods.
- In the 14th period, note the current price, the highest price, and the lowest price.
- In the 15th period, note the current price, highest price, and lowest price, but only for the last 14 periods (not the last 15).
- Compute the new Williams %R value.
- As each period ends compute the new Williams %R, only using the last 14 periods of data.
If this article seems useful to your then please click the like button below. You can also share your valuable feedback or ask questions in the below comment section. Also, subscribe to our newsletter for trading-related updates.


