The Accumulative Swing Index, or ASI, is a tool developed by J. Welles Wilder to measure the breakout potential of a given market.
The ASI takes the form of a number from 100 to -100, with positive values indicating an upward trend and negative values indicating a downward trend.
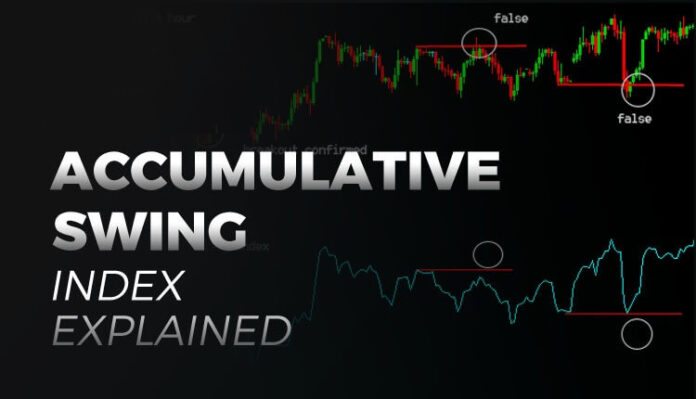
Once calculated, the ASI can be charted in conjunction with a candlestick chart.
The chief value of the ASI is that it’s susceptible to the same technical analysis tools as a candlestick chart, allowing traders to use trendlines, wedges, triangles, and other tools in order to determine support and resistance levels.
However, ASI charts are much simpler and smoother than candlestick charts, making them both easier to analyze and less susceptible to indicating false breakouts.
If the absolute value of the ASI for a given day exceeds the absolute value of the ASI at the time of a previous breakout, a new breakout from the trend is imminent, and traders can take positions accordingly.
The ASI is based on Wilder’s Swing Index, which is an extremely complex calculation that incorporates high, low, and close prices for an asset along with numerous other variables, some of them specific to certain kinds of markets.
On its own, the Swing Index isn’t particularly useful as a predictive tool, but the Swing Indexes for several successive days can be incorporated by another calculation into the ASI, which fulfills Wilder’s original intention for the measure.
Full instructions for calculating the Swing Index and ASI are available in Wilder’s “New Concepts in Technical Trading Systems”, and a number of popular pieces of trading software are able to calculate the ASI automatically.
If this article seems useful to your then please click the like button below. You can also share your valuable feedback or ask questions in the below comment section. Also, subscribe to our newsletter for trading-related updates.


