


A Simple Moving Average (SMA) is a technical indicator that shows the average price of an asset over a specific period of time.
It is calculated by taking a series of prices that are added together and then dividing the total by the number of data points.
For example, if the most recent three prices are 1, 2, 3, then the average would be the sum of the prices (1+2+3) divided by the number of reporting periods.
The sum of the prices is 6 and the number of reporting periods is 3, so 6 divided by 3 equals 2.
The SMA is called a “moving average” because it is plotted on the chart with each bar, forming a line that “moves” along with the chart as the average price changes.
Each time a new price becomes available, the average “moves” so that the average is always based only on the last same number of reporting periods.
Using a Simple Moving Average helps to reduce the noise of fluctuating prices in order to determine the overall trend direction.
How to Use the Simple Moving Average
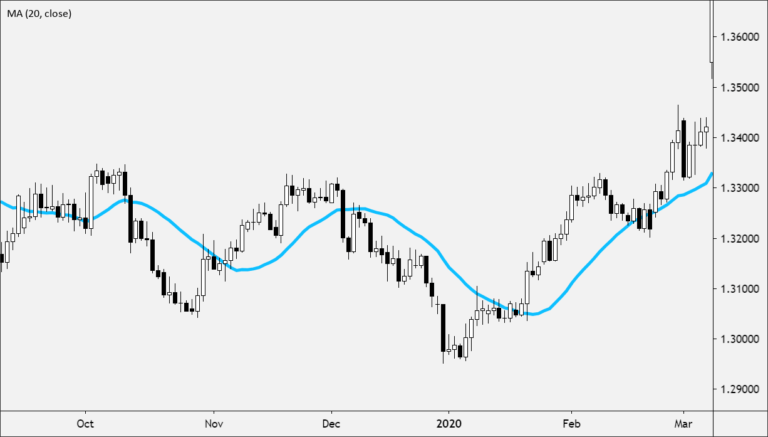
SMAs are used to smooth price data.
The longer the period of the SMA, the smoother the result. But the longer, the period of the SMA< the more lag exists between the SMA and the actual price.
SMAs are used to identify trend direction.
- If the SMA is moving up, the trend is up.
- If the SMA is moving down, the trend is down.
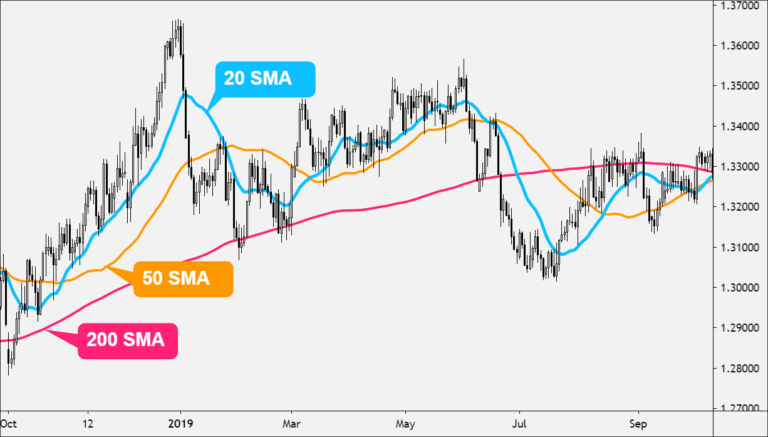
- A 200-period SMA is used to determine the long-term trend.
- A 50-period SMA is used to determine the intermediate trend.
- A 5, 10, or 20-period SMA is used to determine the shorter-term trend.
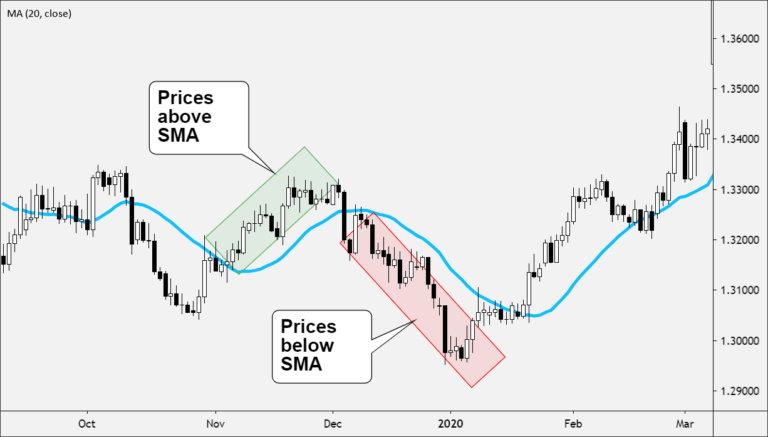
When price crosses above or below an SMA…
- When the price cross above the SMA, it indicates that the price is trending upwards as it is rising at a faster rate than the moving average. This is considered bullish.
- When the price crosses below the SMA, it indicates that the price is trending downwards as it is falling at a faster rate than the moving average. This is considered bearish.
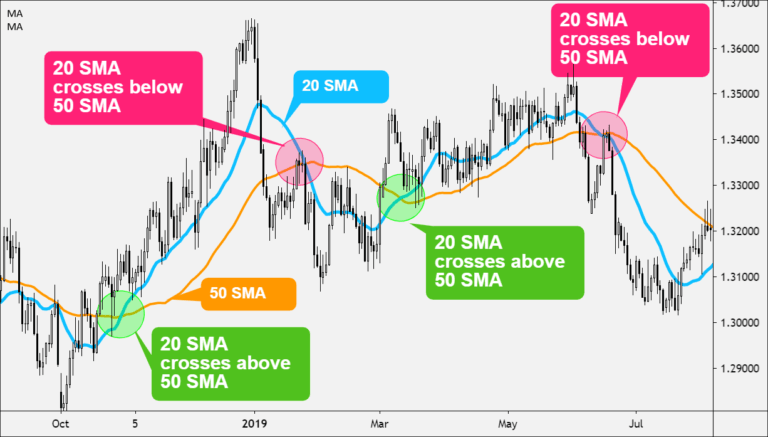
When an SMA crosses above or below another SMA…
- Place two Simple Moving Averages (SMAs) on the same price chart.
- Typically, the “faster” moving average which consists of fewer data points will be selected, as well as a “slower “moving average.
- When the faster-moving average crosses above the slower moving average, this is considered a buy signal.
- When the faster-moving average crosses below the slower moving average, this s considered a sell signal.
How to Calculate Simple Moving Average (SMA)
Unlike the WMA or EMA, the SMA is simply the mean, or average, of the price values over a specified period.
SMA = (A1 + A2 + ……….An) / n
Where:
A = average in period n
n n is the number of periods
If you plotted a 5 period simple moving average on a 1-hour chart, you would add up the closing prices for the last 5 hours, and then divide that number by 5.
Voila! You have the average closing price over the last five hours! String those average prices together and you get a moving average! If you were to plot a 5 period simple moving average on a 30-minute chart, you would add up the closing prices of the last 150 minutes and then divide that number by 5.
If you were to plot the 5-period simple moving average on the 4 hr. chart… Okay, okay, we know, we know. You get the picture!
Most charting packages will do all the calculations for you.
The reason we just bored you (yawn!) with a “how-to” on calculating simple moving averages is that it’s important to understand so that you know how to edit and tweak the indicator.
Understanding how an indicator works means you can adjust and create different strategies as the market environment changes.
Now, as with almost any other forex indicator out there, moving averages operate with a delay.
Because you are taking the averages of past price history, you are really only seeing the general path of the recent past and the general direction of “future” short-term price action.
Disclaimer: Moving averages will not turn you into Ms. Cleo the psychic!
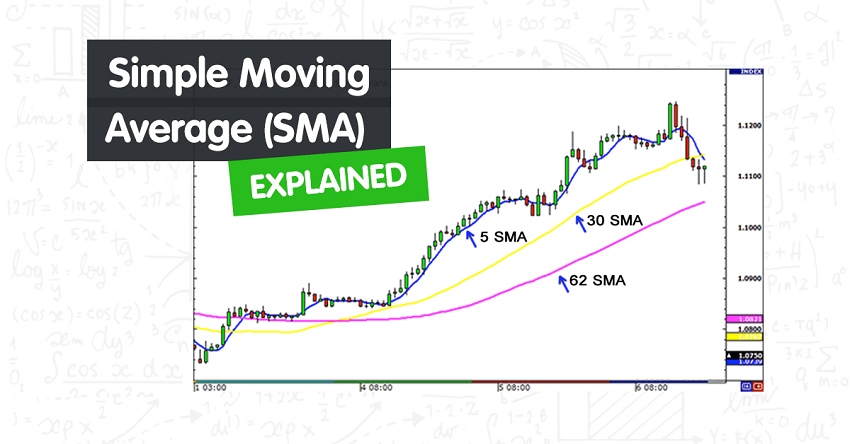
Here is an example of how moving averages smooth out the price action.
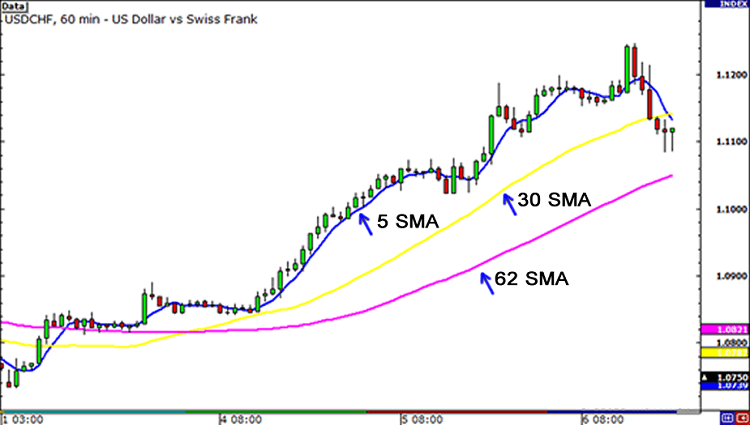
On the chart above, we’ve plotted three different SMAs on the 1-hour chart of USD/CHF. As you can see, the longer the SMA period is, the more it lags behind the price.
Notice how the 62 SMA is farther away from the current price than the 30 and 5 SMAs. This is because the 62 SMA adds up the closing prices of the last 62 periods and divides it by 62. The longer period you use for the SMA, the slower it is to react to the price movement.
The SMAs in this chart shows you the overall sentiment of the market at this point in time. Here, we can see that the pair is trending.
Instead of just looking at the current price of the market, the moving averages give us a broader view, and we can now gauge the general direction of its future price.
With the use of SMAs, we can tell whether a pair is trending up, trending down, or just ranging. There is one problem with the simple moving average: they are susceptible to spikes.
When this happens, this can give us false signals. We might think that a new currency trend may be developing but in reality, nothing changed.
If this article seems useful to your then please click the like button below. You can also share your valuable feedback or ask questions in the below comment section. Also, subscribe to our newsletter for trading-related updates.


