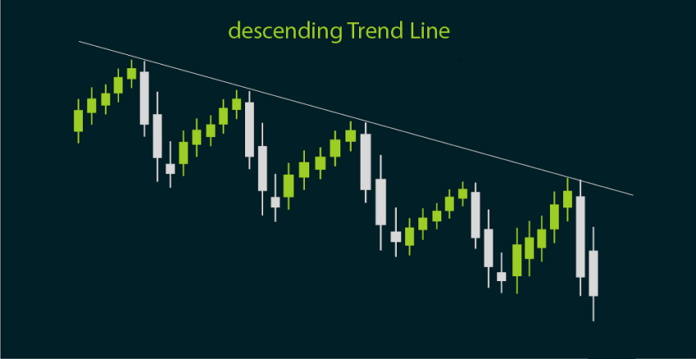
A descending trend line is a chart pattern containing two or more lower highs that can be connected with a straight line that has a negative slope.
It is a bearish pattern created by connecting two or more highs, with each successive high lower than the previous low.
This creates a downward sloping trend line
A descending trend line is also known as a “downtrend line“.
Since technical analysis is built on the assumption that prices trend, the use of trend lines is important for both identifying and confirming trends.
A descending trend line acts as resistance and indicates that supply (more sellers than buyers) is increasing even as the price falls.
A falling price combined with increasing supply is very bearish, and shows really strong selling pressure.
As long as the price action stays below this line, it is a bearish trend.
Price can pull back as the trend line acts as resistance.
Price usually retests a sloped trend line several times, until it breaks at which point we may have a trend reversal.
The more points there are to connect, the stronger a trend line becomes.
The strength of the trend line is also determined by how many market participants recognize the trend line.
If a lot of the market acknowledges the same trend line that you see, then the trend line becomes self-fulfilling.
As long as prices remain below the trend line, the downtrend is considered solid and intact.
A break above the descending trend line indicates that buyer demand has increased and a change in trend could be imminent.
If price breaks through the descending trend line, you can go long the breakout but be aware of fakeouts (false breakouts) though.
If this article seems useful to your then please click the like button below. You can also share your valuable feedback or ask questions in the below comment section. Also, subscribe to our newsletter for trading-related updates.


