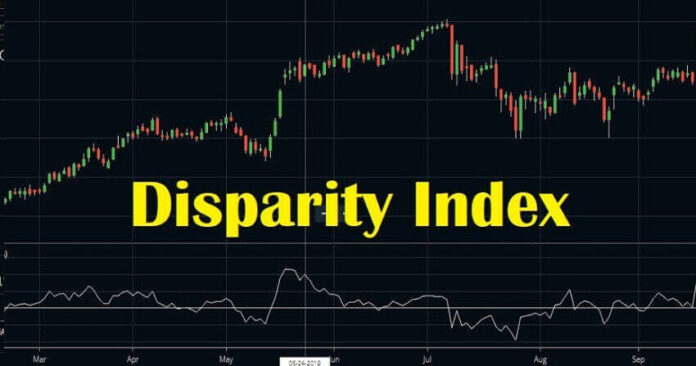
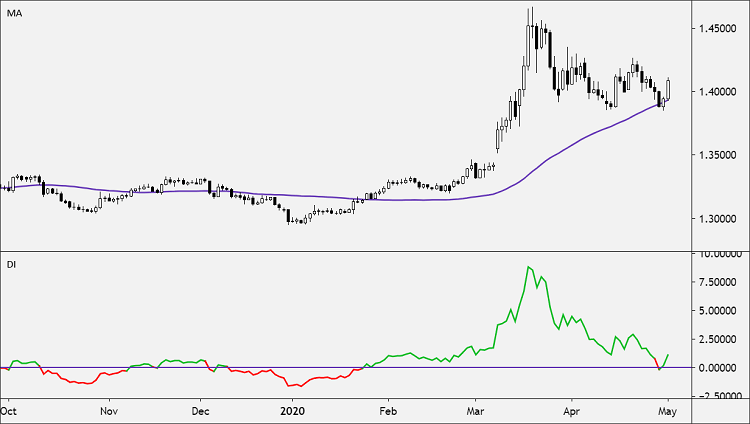
The Disparity Index is a technical indicator that measures the relative position of an asset’s most recent closing price to a specific moving average and reports the value as a percentage.
Traders commonly attribute this measurement to Steve Nison, based on his book, ”Beyond Candlesticks”.
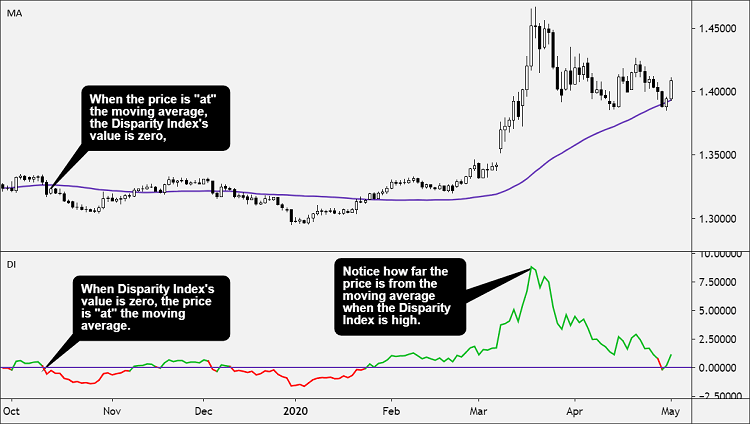
The Disparity Index can take either a positive or a negative value.
- A positive value indicates that the asset’s price is rapidly increasing.
- A negative value indicates that the price is rapidly decreasing.
- A value of zero means that the asset’s current price is exactly consistent with its moving average.
Trading signals are generated when the Disparity Index indicator crosses over the zero line.
The Disparity Index crossing the zero line acts as an early signal of an imminent rapid change in the trend, and therefore the price.
Extreme values in either direction may indicate that a price correction is about to occur.
Nison’s book suggests that the Disparity Index can indicate whether an asset is overbought (in the case of a positive value) or oversold (in the case of a negative.)
Since overbought and oversold levels are vulnerable to rapid price reversals, the Disparity Index is a good indicator of when following the trend of a given asset might be a dangerous proposition.
If this article seems useful to your then please click the like button below. You can also share your valuable feedback or ask questions in the below comment section. Also, subscribe to our newsletter for trading-related updates.


