


The Exponential Moving Average (EMA) is a type of moving average (MA) that places more weight and significance on the most recent prices.
The Exponential Moving Average (EMA) is also known as the Exponential Weighted Moving Average (EWMA).
The Exponential Moving Average (EMA) is similar to the Simple Moving Average (SMA), where it measures trend direction over a period of time.
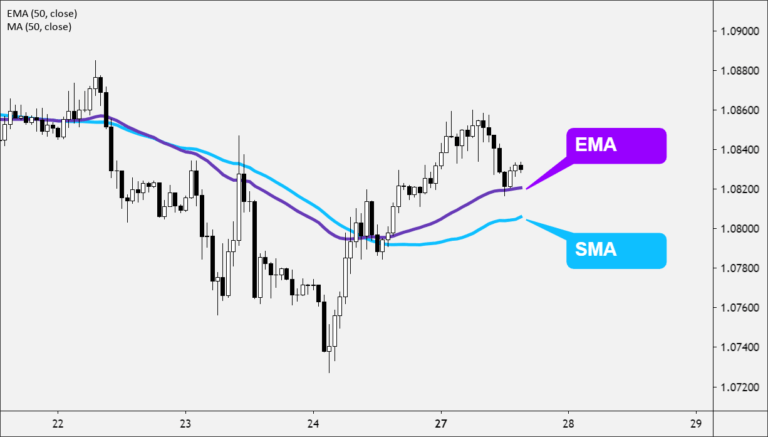
The main difference between the SMA and EMA is that the EMA applies more weight to the price data that are more current, while the SMA simply calculates an average of price.
The way that EMA is calculated allows it to follow prices more closely than a corresponding SMA.
This makes the EMA is more responsive to recent price fluctuations than the SMA.
Exponential Moving Averages
Use the EMA to determine the current trend’s direction and trade in that direction.
- When the EMA rises, consider buying when the price falls near or just below the EMA.
- When the EMA falls, consider selling when the price rises towards or just above the EMA.
Moving averages can also indicate support and resistance areas.
- A rising EMA tends to provide support to the price action
- A falling EMA tends to provide resistance to price action.
This reinforces the strategy of buying when the price is near the rising EMA and selling when the price is near the falling EMA.
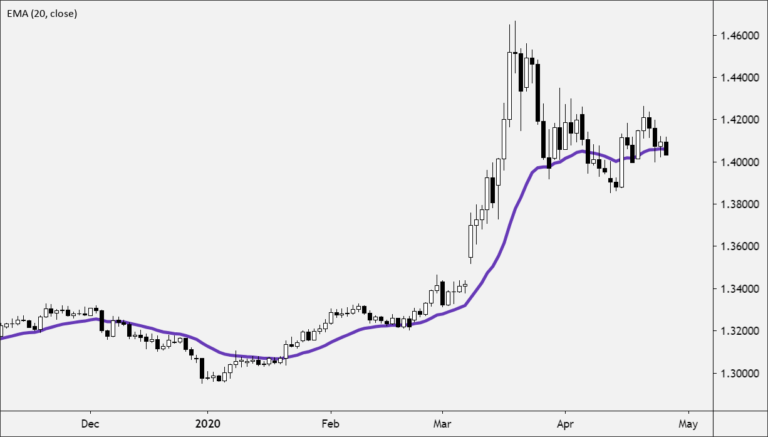
Like all moving average indicators, Exponential Moving Averages are suited for trending markets.
- When the price is in a strong and sustained uptrend, the EMA line will also show an uptrend.
- When the price is in a strong and sustained downtrend, the EMA line will also show a downtrend.
- You should pay attention to both the slope (direction) of the EMA line and the momentum (rate of change) of the EMA line from one candle to the next.
Moving averages, including the EMA, are NOT designed to identify the exact top and bottom of a trend.
Moving averages help you trade in the general direction of a trend, but with a delay in triggering entry and exit points.
When using the same period, the EMA has a shorter delay than the SMA.
Calculate EMA
Notice how the EMA uses the previous value of the EMA in its calculation. This means the EMA includes all the price data within its current value.
The most recent price data has the most impact on the EMA and the oldest price data has only a minimal impact.
EMA = (K x (C - P)) + P
Where:
C = Current Price
P = Previous period's EMA
K = Exponential smoothing constant
The smoothing constant K applies appropriate weight to the most recent price.
It uses the number of periods specified in the moving average.
If this article seems useful to your then please click the like button below. You can also share your valuable feedback or ask questions in the below comment section. Also, subscribe to our newsletter for trading-related updates.


