Heikin Ashi?
You’re probably familiar with the three popular chart types: line chart, bar chart, and the candlestick chart.
But there’s another type of chart that you should know about that uses a totally different technique to display price action.
The Heikin Ashi.
Like the beer?
Umm nope. Let’s focus now. We’re NOT talking about beer here!
We’re talking about CHARTS! (Although the spelling does seem pretty close. ????)
“Heikin Ashi”, also known as “Heikin-Ashi” or “Heiken Ashi” is a charting technique used to display prices that, at a glance, looks similar to a traditional Japanese candlestick chart.
The difference is the method used in how candlesticks are calculated and plotted on a chart.
Traditional Japanese candlesticks are great at helping you find good entry points since they display potential reversals (like a shooting star) or breakout (like a bullish marubozu closing above a resistance level).
But what about once you’re IN a trade?
Applying the Heikin Ashi technique to a price chart can help you decide whether to stay in the trade or get out.
Heikin Ashi charts make candlestick charts more readable for traders who want to know when to stay in a trade and ride a strong trend and when to get out when the trend weakens.
Basically, Heikin Ashi is a modified candlestick charting technique that rearranges how the price is displayed so trend traders can have a higher confidence level when deciding whether to remain in a trade or exit.
Some traders, usually longer-term traders, use Heikin Ashi charts as an alternative to traditional Japanese candlestick charts.
Other traders use them in conjunction with traditional Japanese candlestick charts, switching back-and-forth between the two.
What is Heikin Ashi?
In Japanese, Heikin means “average” and Ashi means “pace”. So together, Heikin Ashi means the “average pace of price”.

Heikin Ashi is a type of candlestick charting technique used to help filter market noise.
The Heikin Ashi technique was created hundreds of years ago by Munehisa Homma, a rice merchant from Sakata, Japan, who is considered the father of the candlestick chart.
So Darth Vader is to Luke Skywalker, as Munehisa Homma is to Heikin Ashi.
Homma realized that by tracking the price action in the rice market, he could actually “see” the psychological behavior of other market participants, and make use of it.
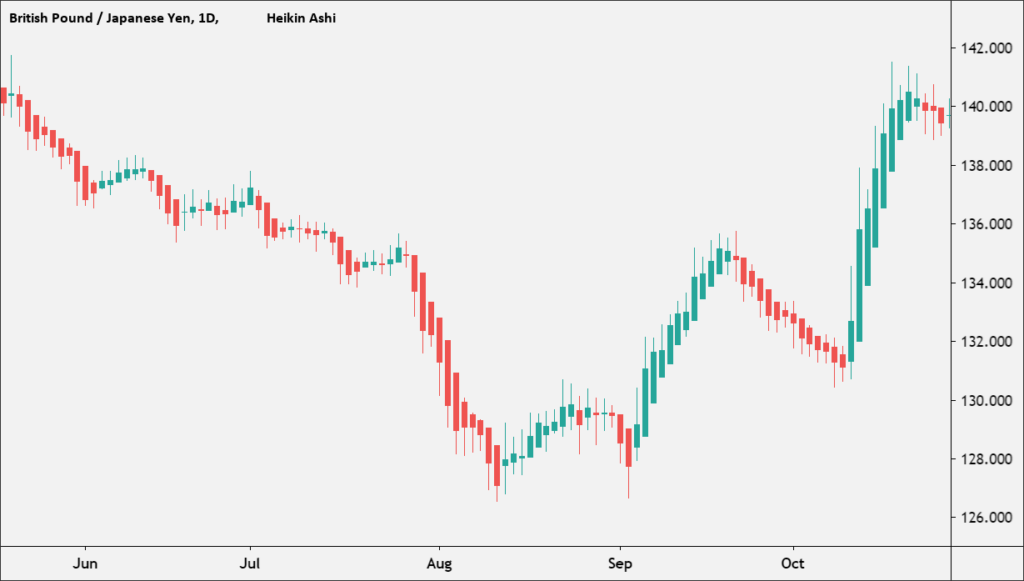
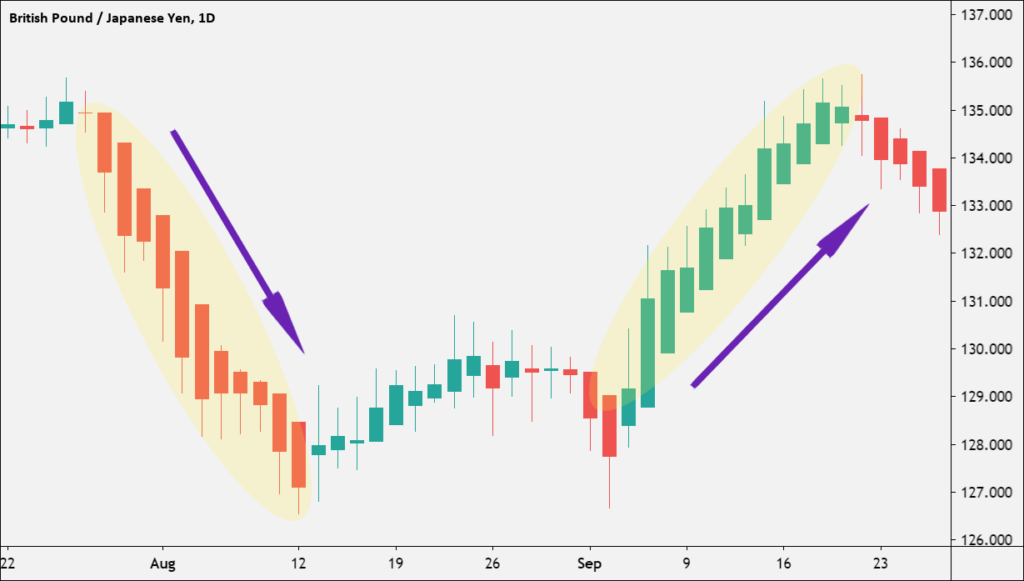
Here’s an example of a Heikin Ashi chart:
To the untrained eye, the chart looks like your typical Japanese candlestick chart.
Each Heiki Ashi candlestick has a body and an upper and/or lower shadow (or wick).
They’re the same right?
Nope.
There’s a BIG difference between the two types of candlestick charts.
Let’s learn what that difference is.
Heikin Ashi vs. Japanese Candlestick
How is Heikin Ashi different from a typical candlestick?
Let’s learn the difference between a Heikin Ashi candlestick versus a traditional Japanese candlestick chart.
A picture is worth a thousand pips so let’s look at some actual charts.
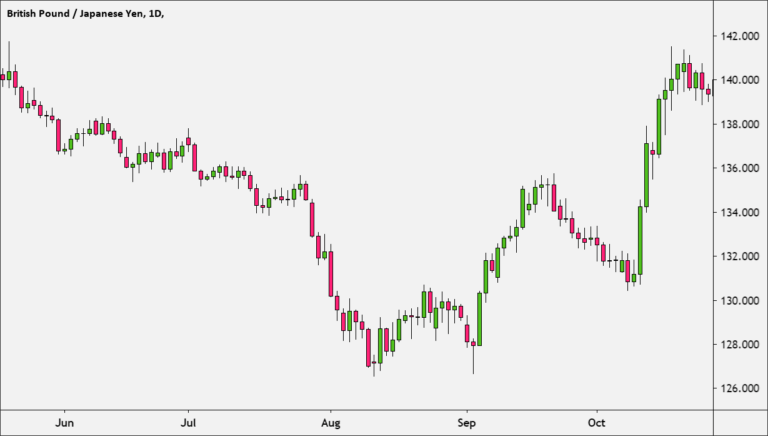
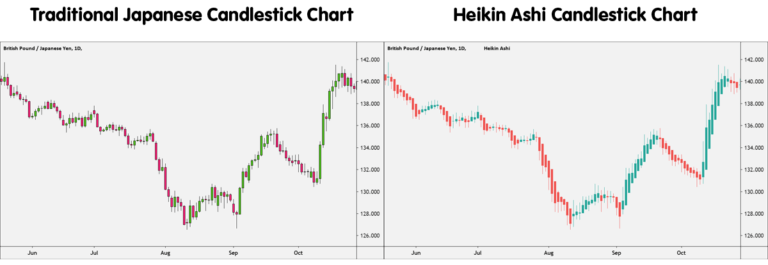
First, here’s a traditional Japanese chart of GBP/JPY on the daily (1D) timeframe:
Here’s the same GBP/JPY displayed with a Heikin Ashi candlestick chart:
Let’s put them both side-by-side:
The chart on the LEFT is the traditional Japanese candlestick chart, and the chart on the RIGHT is the Heikin Ashi chart.
As you can see from the chart on the right, directional moves are smoothed out in a way absent from the left chart.
Candles on traditional Japanese candlestick charts frequently change from green to red (up or down) which can make them difficult to interpret.
On the other hand, candles on the Heikin Ashi chart display more consecutive colored candles, helping traders to identify past price movements more easily.
You’ll notice that Heikin Ashi charts have a tendency for its candles to stay green during an uptrend and stay red during a downtrend.
This is in contrast to traditional Japanese candlesticks that alternate color even if the price is moving strongly in one direction.
There are times when the candlesticks change color almost as often as Kylie Jenner changes her hair color.
You probably didn’t even notice the image above is a candlestick chart. ????
Anyways, back to the side-by-side chart…
You can clearly see that the Heikin Ashi chart is much smoother looking in terms of price action.
This is why some forex traders prefer to use the Heikin Ashi candles since it reduces the noise on the chart, and allows them to analyze trends more clearly.
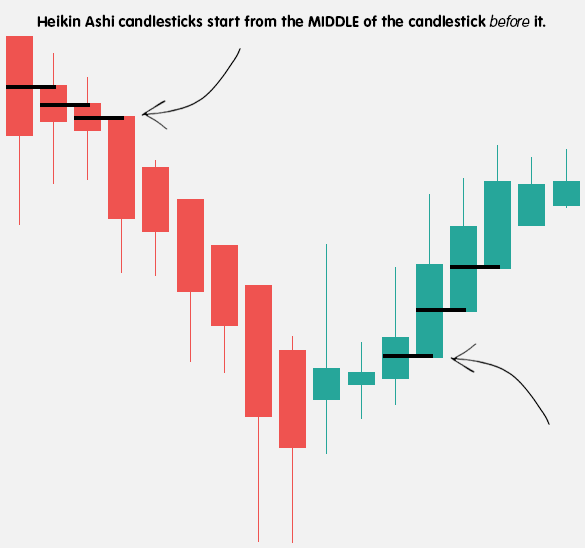
What makes Heikin Ashi different from a traditional Japanese candlestick chart is how the price is displayed in terms of the open and the close.
If you look closely at the Heikin Ashi chart, you’ll notice that each of the Heikin Ashi candlesticks starts from the MIDDLE of the candlestick before it, and not from the level where the previous candlestick had closed.
Heikin Ashi candlesticks “act” this way due to the way they are calculated.
In the next lesson, you’ll learn how to calculate Heikin Ashi so you can sound super smart at dinner parties.
Heikin Ashi Calculation
How do you calculate Heikin Ashi?
Let’s learn how Heikin Ashi candlesticks are calculated and plotted on a chart.
Like we mentioned in the previous lesson, to a noob’s eye, they may look like regular candlesticks but they….are….not.
It’s kind of like being able to tell the difference between a wolf and a dog.

Looks cute and adorable right? Looks harmless?
Like you want to hug it?
Is this a Husky doggo or a wolf?
Before you go try and pet it, you better be able to tell the difference before you get your face bit off and blood starts gushing everywhere and you attract an entire wolf pack providing them an all-you-can-eat buffet.
It’s the same way with Heikin Ashi charts and traditional Japanese candlestick charts, you better be able to tell them apart or your trading account might end up bleeding red.

With traditional Japanese candlestick charts, each candlestick represents the open, high, low, and close that the price makes within the current time period.
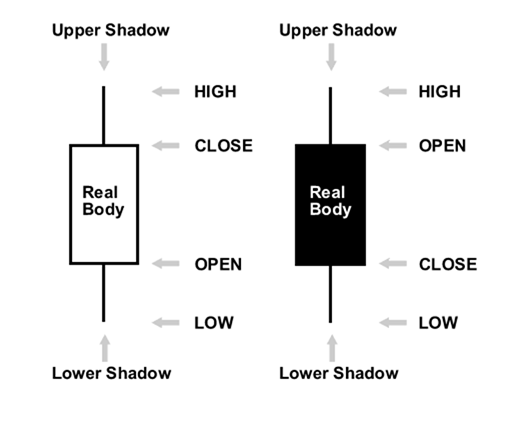
With Heikin Aishi candlestick charts, each candlestick doesn’t just include price movement within the current time period, it also includes price information from the past.
Say what?
Let’s see how a Heikin Ashi candlestick is calculated and take it one step at a time.
First, let’s throw up a Heikin Ashi chart of GBP/JPY to use as reference:
As you can see, it’s similar to a traditional Japanese candlestick except that the open and close are calculated differently.
Just like a regular Japanese candlestick, each Heikin Ashi candle has an open, close, high, and low.
This means that there are FOUR parts of the Heikiin Aishi formula:
The OPEN of a Heikin Ashi candlestick equals the MIDPOINT of the previous candle.
If you look closely at the chart, you’ll notice that every new candlestick starts from the middle of the previous one.
Open = [(Open price of previous candle) + (Close price of previous candle)] / 2
The CLOSE of each Heikin Ashi candlestick equals the average value between the four parameters: open, close, high, and low:
Close = (Open + High + Low + Close) / 4
The HIGH of a Heikin Ashi candlestick takes the actual high of the period. This could be the highest shadow, the open, or the close. Whichever is the highest.
High = Maximum Price Reached
The LOW of a Heikin Ashi candlestick takes the actual low of the period. This could be the lowest shadow, the open, or the close. Whichever is the lowest.
Low = Minimum Price Reached
The general idea behind the Heikin Ashi candlesticks is that they smooth the price action.

Much of the market noise shown with traditional Japanese candlestick charts are minimized with the Heikin Ashi candlestick chart.
Here’s a summary of the Heikin Aishi formula:
Heikin Ashi Formula:

High = Maximum of High, Open, or Close (whichever is highest)
Low = Minimum of Low, Open, or Close (whichever is lowest)

Open = [Open (previous bar) + Close (previous bar)] /2
Close = (Open + High + Low + Close) / 4
Using in the Chart
How do you use Heikin Ashi?
Now that you’ve learned how to calculate Heikin Ashi candlesticks, let’s discuss how to use and read a Heikin Ashi candlestick chart.
The idea behind using a Heikin Ashi chart is that it filters market noise.
And since noise is filtered, you basically see the naked trend.

Because the Heikin Ashi candlesticks are calculated based on averages, the candlesticks will have smaller shadows (wicks) than a regular Japanese candlestick.
Just like with regular Japanese candlesticks, with a Heikin Ashi candlestick, the smaller (or shorter) the shadow (or wick), the stronger the trend.
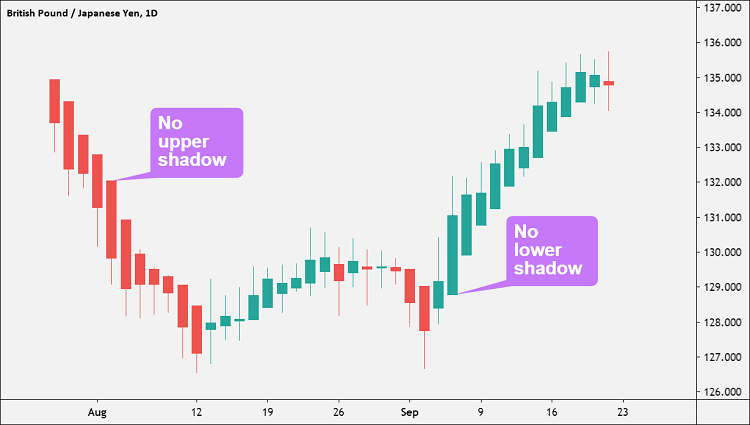
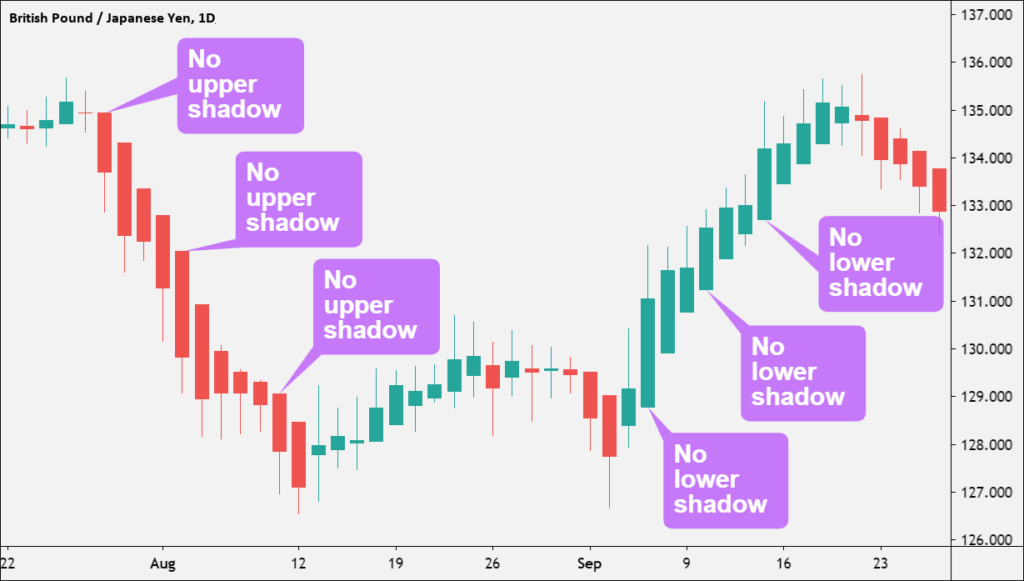
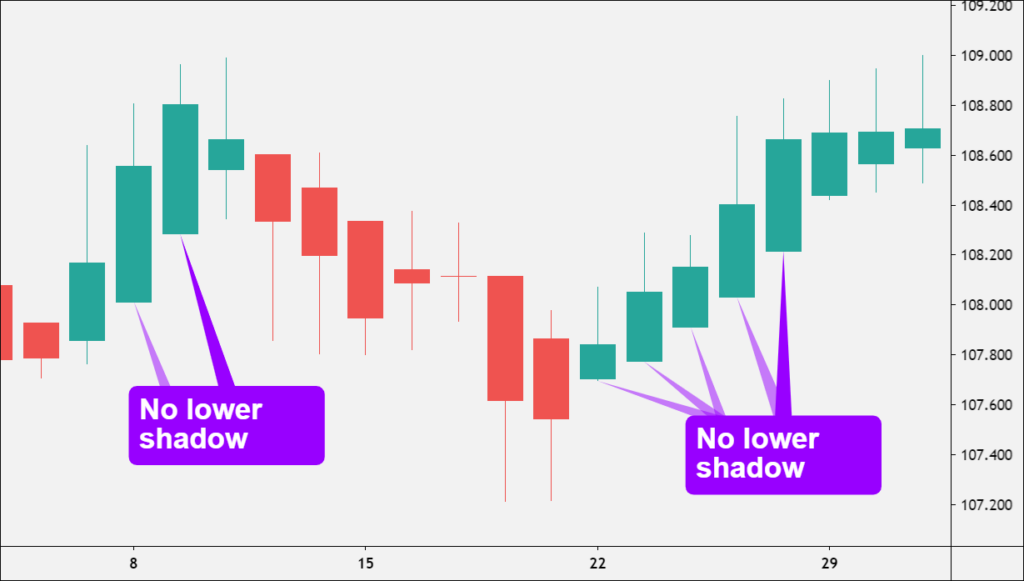
Green candles with no lower shadow signal a strong UPTREND.
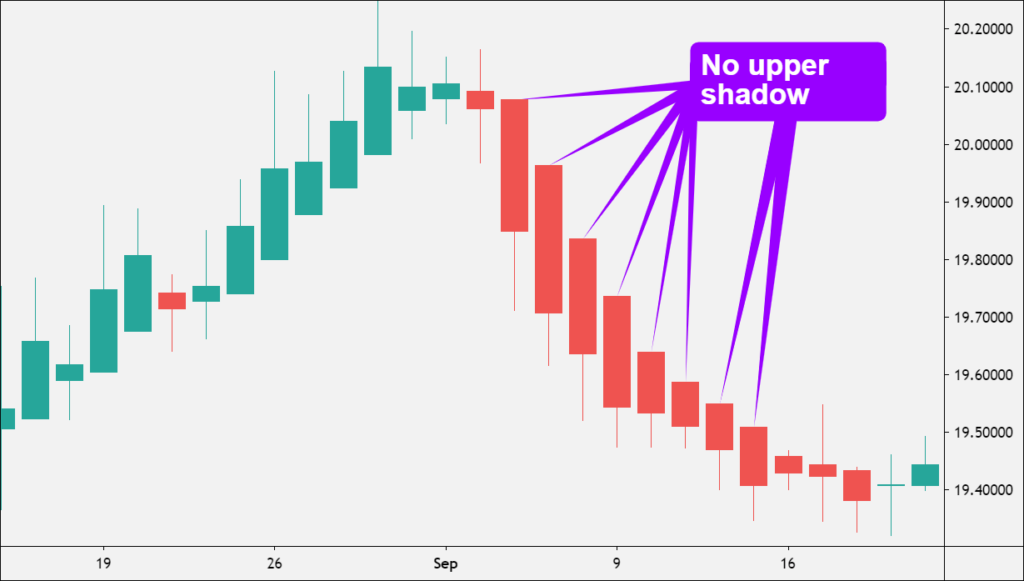
Red candles with no upper shadow signal a strong DOWNTREND.
Heikin Ashi charts are used by technical traders to IDENTIFY:
- Trend DIRECTION
- Trend STRENGTH
So If your goal is to catch trends and ride them as long as possible, then you may want to learn how to use a Heikin Ashi chart.
Identify Trend Direction
A Heikin Ashi chart shows you the direction of a trend through its color-coded candles.
A green candle is telling you that trend is UP. A red candle is telling you that the trend is DOWN.
Identify Trend Strength
A Heikin Ashi chart shows you the strength of the trend by observing the shadows (or wicks).
You’ll notice that for many of the green candles, there is no lower shadow or wick.
Vice versa for the red candles. Most do not have any upper shadows or wicks.
These candlesticks do not show a shadow in the OPPOSITE direction of the trend.
When there is no shadow, this means you’re on a strong trend.
So the main thing you want to look for on a Heikin Ashi chart to determine trend strength is shadowless or wickless candlesticks opposite the trend.
Candlesticks that have no shadow or wick on one end are also called “shaved candles“.
Depending on which end lacks a shadow, there’s a name for each type of shaved candle.
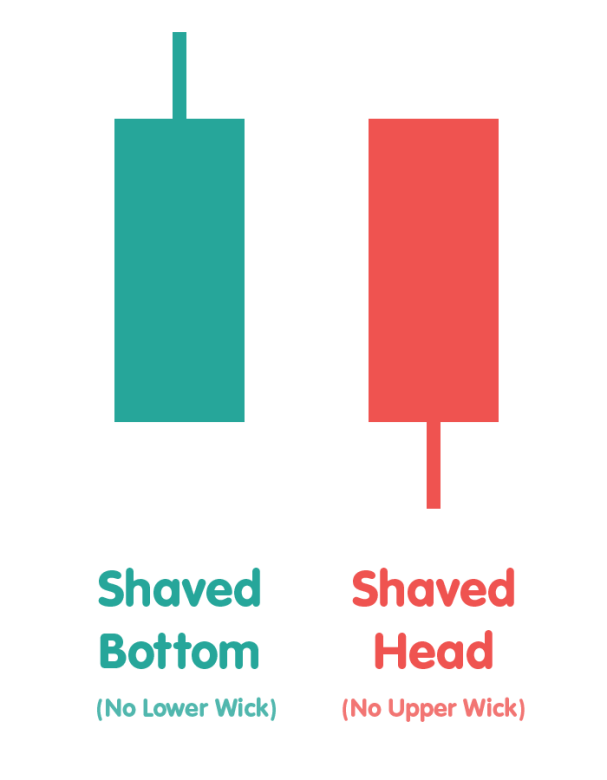
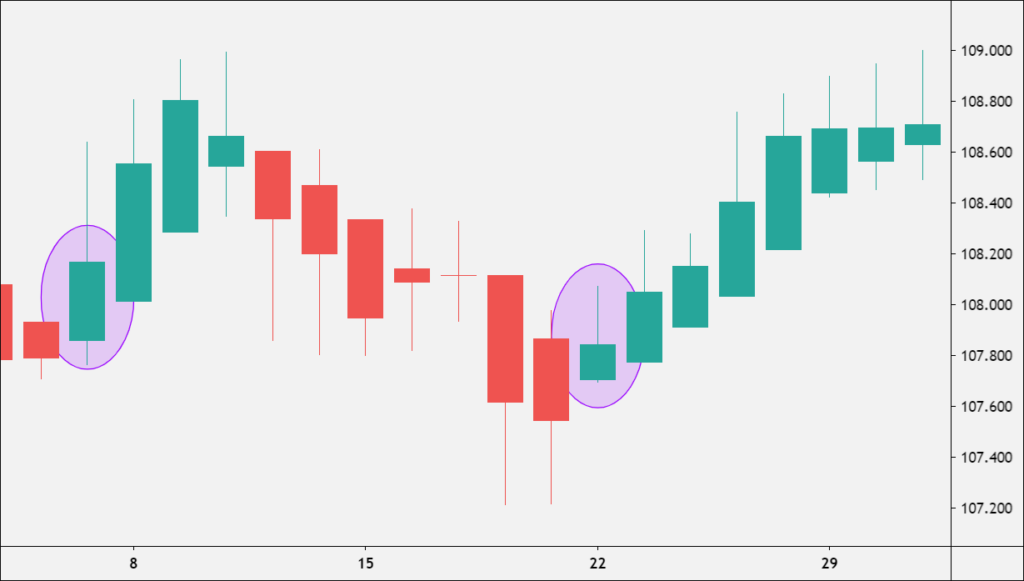
If there is no lower shadow/wick, also known as having “no tail”, the candle is called a “shaved bottom“.
“Shaved butt” would’ve been a better name in our opinion. ????
If there is no upper shadow/wick, also known as having “no head”, the candle is called a “shaved head“.
Technically, the color of the candle does NOT matter, as long a candle lacks a tail or head, but for the purposes of Heikin Ashi, we want to see shaved bottoms that are green and shaved heads that are red since we’re looking for trend strength.
Heikin Ashi Trading
How do you trade Heikin Ashi?
Heikin Ashi allows traders to look for the emergence of new trends or for the reversal of already existing trends.
Here are five basic ways to use Heikin Ashi charts in your trading.
1. Green candlesticks signal an uptrend.
When the Heikin Ashi candle changes from red (bearish) to green (bullish), it’s a sign that the price might be about to turn higher.
If you’re currently in a short position, you may want to exit.
If you’re currently in a long position, you may want to add to your position.
2. Green candlesticks with no lower shadow or wick indicate a strong uptrend.
If you see a lot of green shaved bottoms, you’ll see a strong uptrend.
Stay long and until the Heikin Ashi candlestick changes color, from green to red.
Ride the uptrend as long as no lower shadows appear and let your profits run.
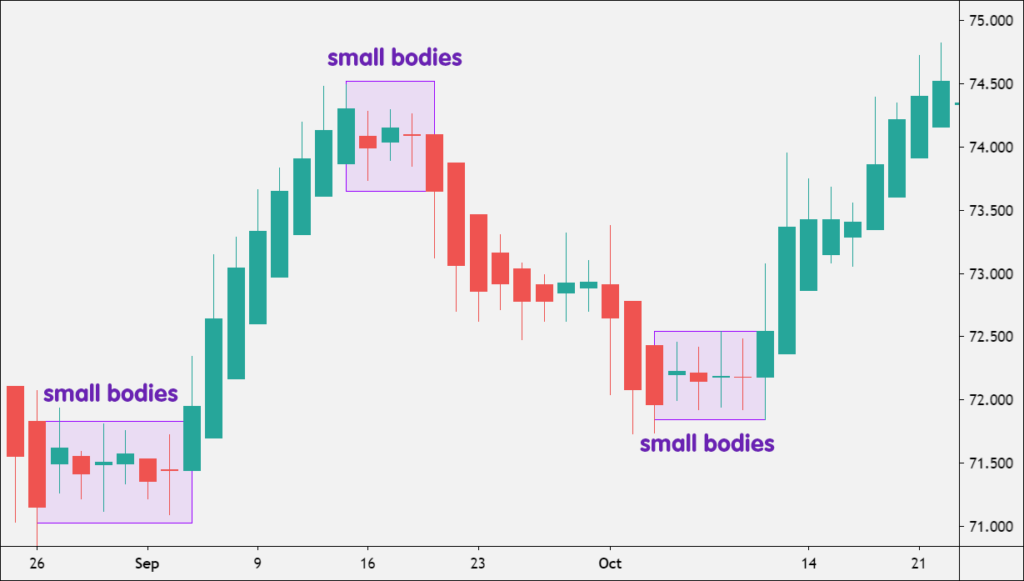
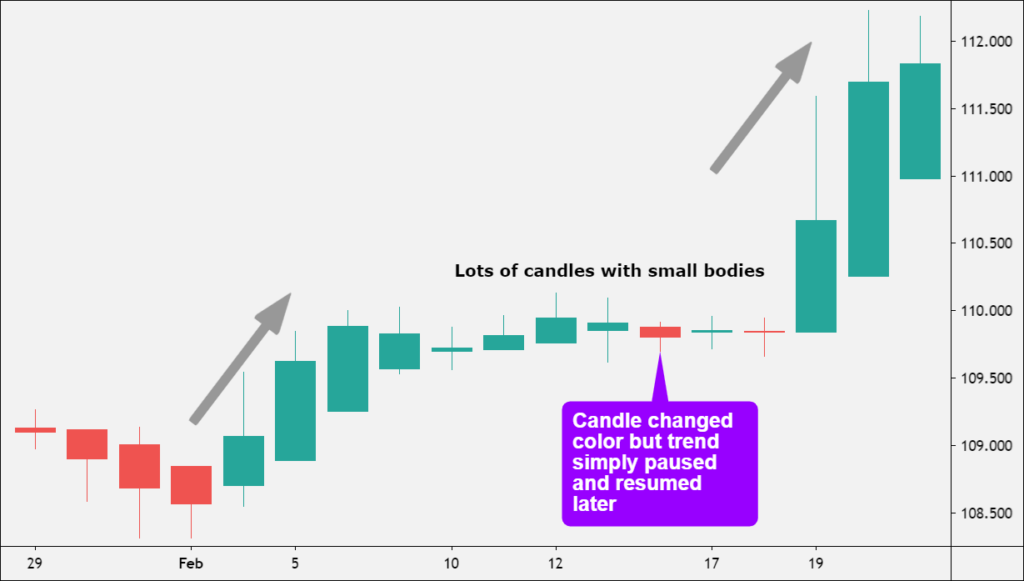
3. Candlesticks with small bodies showing upper and lower shadows indicated a possible trend reversal (or trend pause).
Open a position opposite the current trend since the trend may be coming to an end.
Keep in mind that though IF the next candlestick changes color, it does NOT always mean the end of a trend, it could just be a pause.
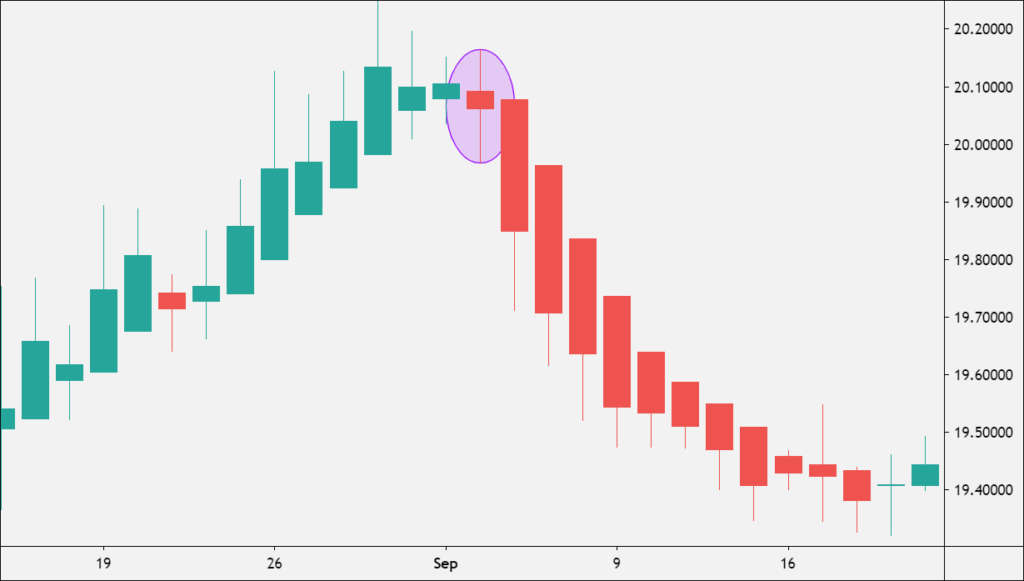
4. Red candlesticks signal a downtrend.
When the Heikin Ashi candle changes from green (bullish) to red (bearish), it’s a sign that the price might be about to turn lower.
If you’re currently in a long position, you may want to exit.
If you’re currently in a short position, you may want to add to your position.
5. Red candlesticks with no upper shadow or wick indicate a strong downtrend.
Notice the amount of red-shaved heads? That’s a strong downtrend.
Stay short and until the Heikin Ashi candlestick changes color, from red to green.
Stay short and ride the downtrend as long as no upper shadows appear and let your profits run.
Limitations of Heikin Ashi
What are the limitations of Heikin Ashi?
Unfortunately, Heikin Ashi is not the holy grail.
Heikin Ashi definitely ain’t no Ed Sheeran song. It ain’t perfect.
Just like any other tool used for technical analysis, Heikin Ashi is useful but it does have some weaknesses or limitations.
Let’s go over what these limitations are.
1. Heikin Ashi candlesticks do not show true prices.
While the traditional Japanese candlesticks are derived from the actual prices, Heikin Ashi candlesticks are NOT.
Because the Heikin Ashi candlesticks are averaged, they do NOT show the exact open and close prices for a particular time period.
Let’s show an actual example.
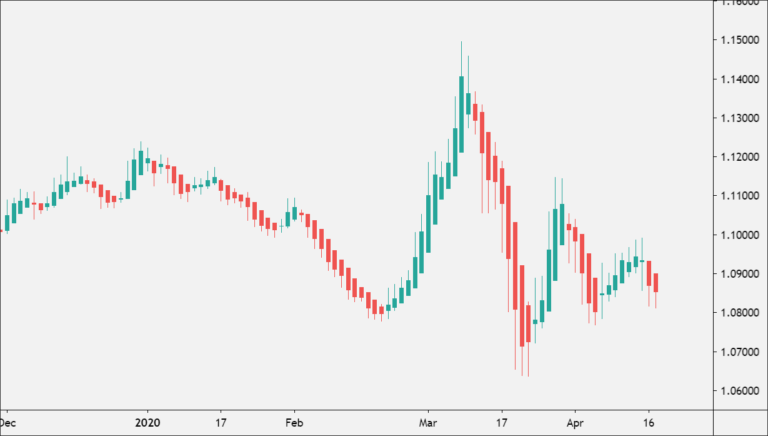
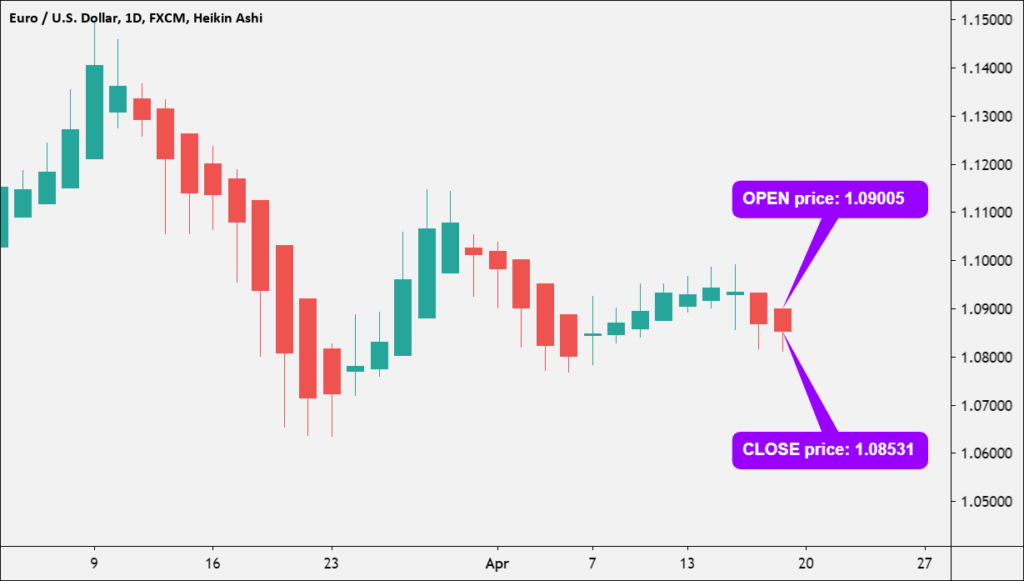
Here’s a Heikin Ashi chart of EUR/USD on the daily (1D) timeframe:
Focus on the last candlestick. A couple of things to notice:
- The candle is red. Which means the candle closed lower than it opened.
- Its open price was 1.09005.
- Its close price was 1.08531.
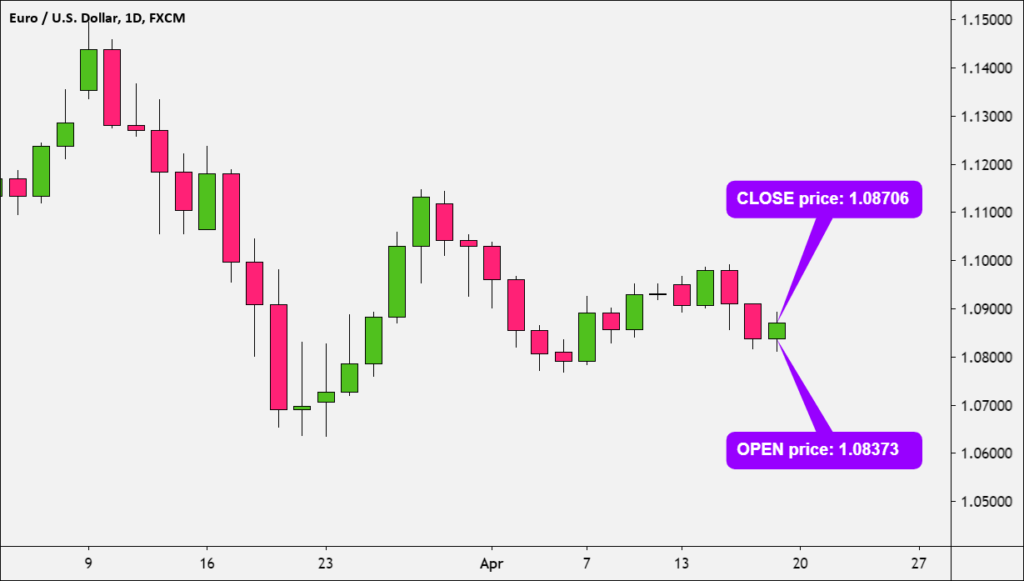
Now let’s look at a daily chart of EUR/USD using a traditional Japanese candlestick chart:
Focus on the last candlestick. A couple of things to notice:
- The candle is green. Which means the candle closed higher than it opened.
- This is REALITY. The EUR/USD pair actually ended up for the day. Compare this to Heikin Ashi, where it showed a red candle.
- Its open price was 1.08373.
- Its close price was 1.08706.
Let’s review what we just observed:
| Chart Type | Last Candlestick | Open Price | Close Price |
| Heikin Ashi Candlestick | Red | 1.09005 | 1.08531 |
| Traditional Candlestick | Green | 1.08373 | 1.08706 |
Do you see the difference?
Even though the “real” candle closed green, Heikin Ashi is signaling that EUR/USD is still in a downtrend.
Make sure you know what price you’re looking at.
Since you can’t see the actual open and close prices, some traders prefer to use a Heikin Ashi chart as more of an INDICATOR rather than a price chart itself.
2. Heikin Ashi charts obscure actual price information.
This limitation is related to the first one.
The closing price is considered important for many traders, but the actual closing price is NOT displayed on a Heikin Ashi candlestick.
As a review, here’s how the Close price is calculated:
Close = (Open+High+Low+Close) / 4
You only see the average closing price.
Make sure you’re aware of the actual closing price, and not just the average value.
This can be done easily by switching back to a regular Japanese candlestick chart.
3. Heikin Ashi charts may not be responsive enough for day traders or scalpers.
Since Heikin Ashi candlestick requires price information from two periods, a trade setup takes longer to develop.
This isn’t really an issue for longer-term traders, like swing traders or position traders, who have more time to let their trades develop.
But it might be an issue for shorter-term traders like day traders and scalpers.
For example, scalpers need to exploit quick price moves so they may find that Heikin Ashi charts are not responsive enough for their type of trading.
If this article seems useful to your then please click the like button below. You can also share your valuable feedback or ask questions in the below comment section. Also, subscribe to our newsletter for trading-related updates.


