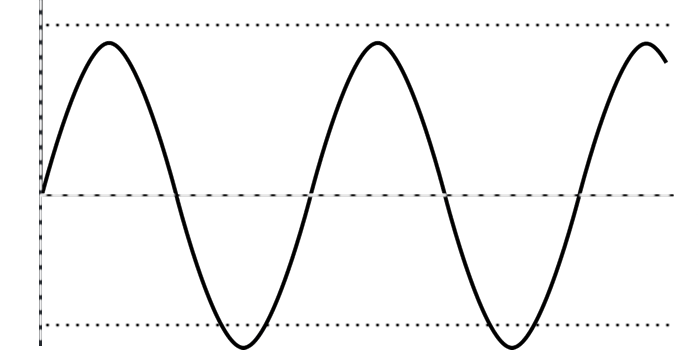
An oscillator is a technical indicator that gravitates between two levels on a price chart.
Oscillators measure momentum. and are designed to show when an asset is potentially overbought or oversold.
Oscillators work under the theory that as momentum begins to slow, fewer active buyers and sellers are willing to trade at the current price.
Oscillators can help distinguish between reversals and fluctuations.

They are frequently used as a barometer to measure pricing momentum as it relates to trend extension, exhaustion, and trend reversal.
There are two broad categories of oscillators:
- Centered oscillators that fluctuate above and below a center point or line.
- Banded oscillators that fluctuate between overbought and oversold extremes.
Generally, centered oscillators are best suited for analyzing the direction of price momentum, while banded oscillators are best suited for identifying overbought and oversold levels.
Momentum indicators, which are a type of oscillator, are graphic devices that can show how rapidly the price of a given asset is moving in a particular direction.
Also, they can give traders an idea of whether the price trend is likely to continue.
The principle behind the momentum indicator is that as an asset is traded, the speed of the price movement reaches a maximum when the entrance of new buyers is at its peak.
When there are no more buyers left, the tendency after the peak is for the price trend to flatten or reverse direction.
The most well-known oscillators are Momentum, Stochastic, the Relative Strength Index (RSI), MACD, and the CCI
If this article seems useful to your then please click the like button below. You can also share your valuable feedback or ask questions in the below comment section. Also, subscribe to our newsletter for trading-related updates.


