


Momentum Intro
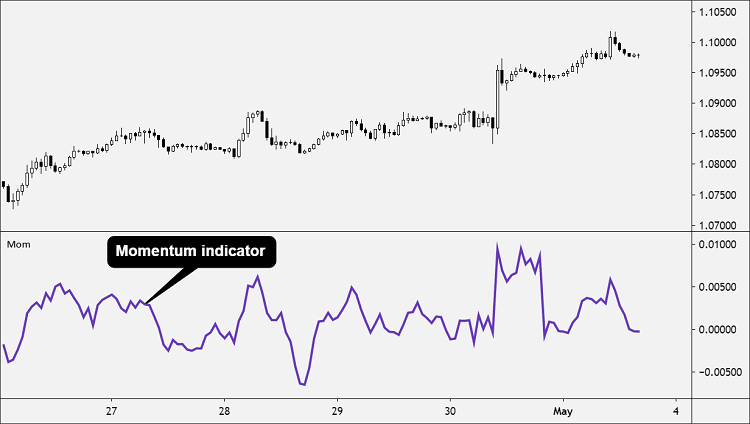
The Momentum indicator identifies when the price is moving upward or downward and how strongly.
Momentum measures the rate of change in prices as opposed to the actual price changes themselves.
Momentum is measured by continually taking price differences for a fixed time period.
For example, to create a 10-day period momentum line, you would subtract the closing price from 10 days ago from the most recent closing price.
It compares where the current price is in relation to where the price was in the past.
The result is then plotted around a zero line.
if the current price is higher than the price in the past, then the Momentum indicator is positive.
If the current price is lower than the price in the past, then the Momentum indicator is negative.
A momentum value above zero indicates that the price is moving up
A momentum value below zero indicates that the price is moving down.
How to Use?
Since the Momentum indicator does not have an upper and lower boundary, you must visually inspect the history of the momentum line and draw horizontal lines along its upper and lower boundaries.
When the momentum line reaches these levels it may indicate that the currency pair may be overbought or oversold.
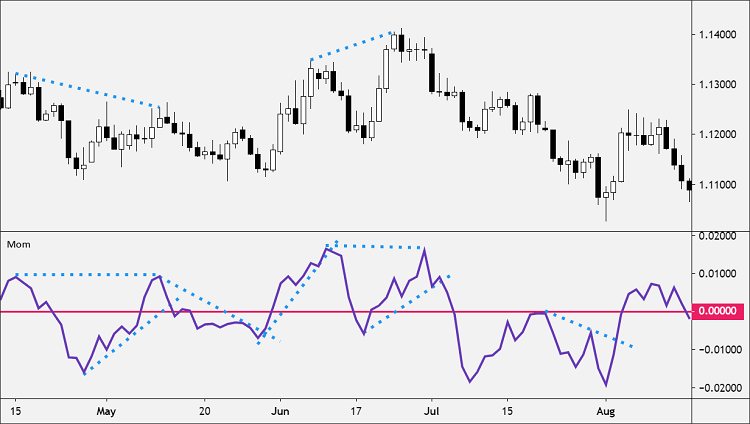
Momentum is an unbound oscillator, meaning there is no upper or lower boundary. This makes interpreting whether a currency pair is overbought or oversold subjective.
When the Momentum indicator is overbought, the price can continue to move higher.
When the Momentum indicator is oversold, the price can continue lower as well.
Use the Momentum indicator in conjunction with additional technical indicators or price action analysis when attempting to read overbought or oversold conditions.
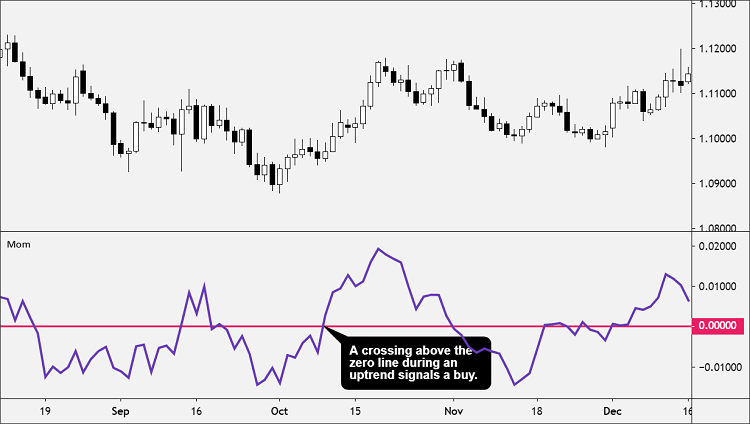
A crossing above the zero line during an uptrend signals a buy.
A crossing below the zero line during a downtrend signals a sell.
When using these signals, you should trade in the direction of the overall trend.
Momentum as Volume
Momentum can be used as a measure of the volume of a market.
If prices are changing rapidly (meaning that momentum is high), it’s likely that a large number of traders are buying or selling the asset to push the price change in either direction.
Extremely high or extremely low values for momentum are taken as signs that an asset is either overbought or oversold.
If momentum reaches an extreme high, the asset is considered overbought.
If momentum reaches an extreme low, the asset is considered oversold.
When momentum reaches an extreme low and then rapidly advances back upward across the zero line. this signals a buy.
When momentum reaches an extreme high and then rapidly falls below the zero line, this signals a sell.
How to Calculate?
The momentum of a price is very easy to calculate.
The momentum (M) is a comparison between the current closing price (CP) and a closing price “n” periods ago (CPn).
You determine the value of “n.”
M = CP – CPn
The Momentum indicator isn’t going to provide much information beyond what can be seen just by looking at the price chart itself.
If the price is moving aggressively higher, this will be visible on the price chart as well as on the Momentum indicator.
The Momentum indicator can be used to provide trade signals, but it is better used to help forex traders confirm the validity of trades based on price action such as breakouts or pullbacks.
If this article seems useful to your then please click the like button below. You can also share your valuable feedback or ask questions in the below comment section. Also, subscribe to our newsletter for trading-related updates.


