


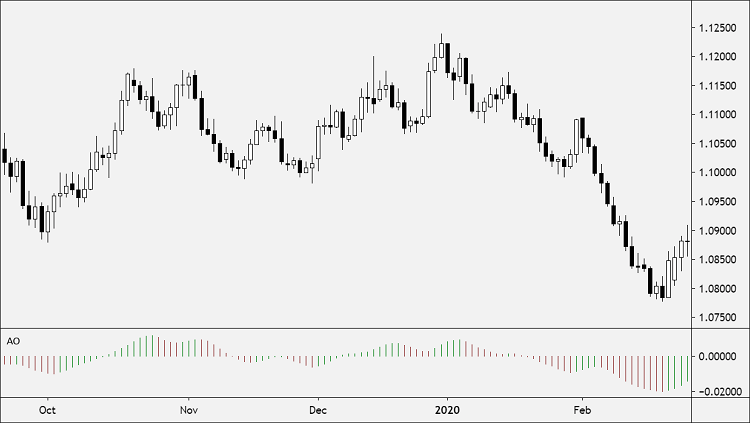
The Awesome Oscillator (AO) is a technical indicator created by Bill Williams that’s used to measure momentum.
AO calculates the difference between a 34-period and 5-period Simple Moving Averages.
The Simple Moving Averages that are used are not calculated using closing price but rather each bar’s midpoints.
The Awesome Oscillator is generally used to confirm trends and anticipate possible reversals.
How to Use Awesome Oscillator
Here are three ways to use the Awesome Oscillator:
Zero Line
- When the Awesome Oscillator is below the zero lines forming a peak, go short.
- When the Awesome Oscillator is above the zero lines forming a gap, go long.
Twin Peaks
- Twin Peaks is a method that considers the differences between two peaks on the same side of the zero lines.
- When the Awesome Oscillator forms two peaks above the zero line, where the second high is lower than the previous one, go short.
- The trough between both peaks must remain above the Zero Line for the duration of the setup.
- When the Awesome Oscillator forms two lows below the zero line, where the second low one is higher than the previous one, so long.
- The trough between the two lows must remain below the Zero Line the entire time.
Crossing the Zero Line
- When the AO value crosses above or below the zero line. This indicates a change in momentum.
- When the Awesome Oscillator crosses it from up to down, go short.
- When the Awesome Oscillator crosses from down to up, go long.
Awesome Oscillator Trading Strategy
Awesome Oscillator generates three types of trading signals:
1. Saucer
A Saucer Setup looks for more rapid changes in momentum.
The Saucer method looks for changes in three consecutive bars, all on the same side of the Zero Line.
A Bullish Saucer setup occurs when the AO is above the Zero Line. It entails two consecutive red bars (with the second bar being lower than the first bar) being followed by a green Bar.
A Bearish Saucer setup occurs when the AO is below the Zero Line. It entails two consecutive green bars (with the second bar being higher than the first bar) being followed by a red bar.
2. Nought Line Cross
The histogram crosses the naught line in an upward direction changing its values from negative to positive ones. In this situation, we have a Buy signal. The Sell signal would be a reversed pattern.
3. Two Pikes
The indicator displays a Buy signal when the figure is formed by two consecutive pikes both of which are below the naught line and the later-formed pike is closer to the zero level than the earlier-formed one. The Sell signal would be given by the reverse formation.
Calculation
Awesome Oscillator is a 34-period simple moving average, plotted through the central points of the bars (H+L)/2, and subtracted from the 5-period simple moving average, graphed across the central points of the bars (H+L)/2.
MEDIAN PRICE = (HIGH+LOW)/2
AO = SMA(MEDIAN PRICE, 5)-SMA(MEDIAN PRICE, 34)
Where:
SMA = Simple Moving Average.
Default Parameters:
Period1 (5) – The number of periods to use for the first simple moving average.
Period2 (34) – The number of periods to use for the second simple moving average.
Period3 (10) – The number of periods to use for the SMA applied to the above 2 moving averages.
If this article seems useful to your then please click the like button below. You can also share your valuable feedback or ask questions in the below comment section. Also, subscribe to our newsletter for trading-related updates.


