


The Commodity Channel Index (CCI) is a technical indicator that measures the current price level relative to an average price level over a given period of time.
It was created by Donald Lambert and originally designed to identify cyclical turns in commodities. The CCI is categorized as a momentum oscillator, which means that CCI is used to identify overbought and oversold levels.
The fundamental assumption behind the CCI indicator is that commodities move in cycles, with highs and lows coming at periodic intervals.
The CCI indicates when one of those cyclical reversals is imminent.
While Lambert originally used CCI to trade commodities, the indicator is used across different assets nowadays.
How CCI Works
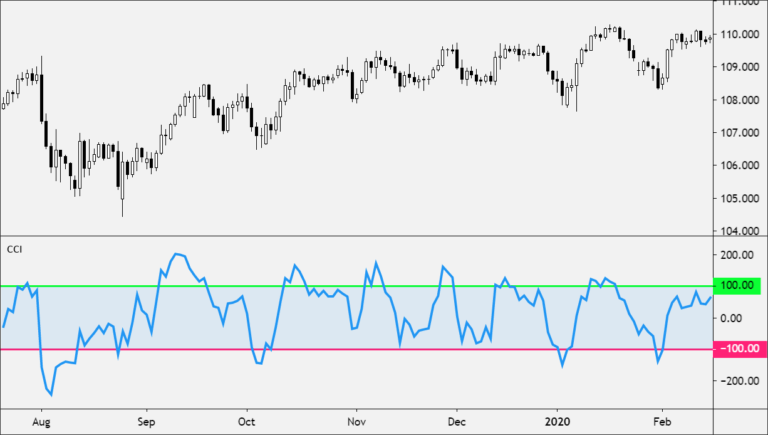
The Commodity Channel Index (CCI) measures the current price level relative to an average price level over a given period of time.
The CCI fluctuates above and below zero.
- CCI is relatively high when prices are far above their average.
- CCI is relatively low when prices are far below their average.
Using this method, CCI can be used to identify overbought and oversold levels.
The percentage of CCI values that fall between +100 and -100 will depend on the number of periods used.
- A shorter CCI will be more volatile with a smaller percentage of values between +100 and -100.
- The more periods used to calculate the CCI, the higher the percentage of values between +100 and -100.
Lambert’s trading guidelines for the CCI focused on movements above +100 and below -100 to generate buy and sell signals.
Because about 70 to 80 percent of the CCI values are between +100 and -100, a buy or sell signal will only generate 20 to 30 percent of the time.
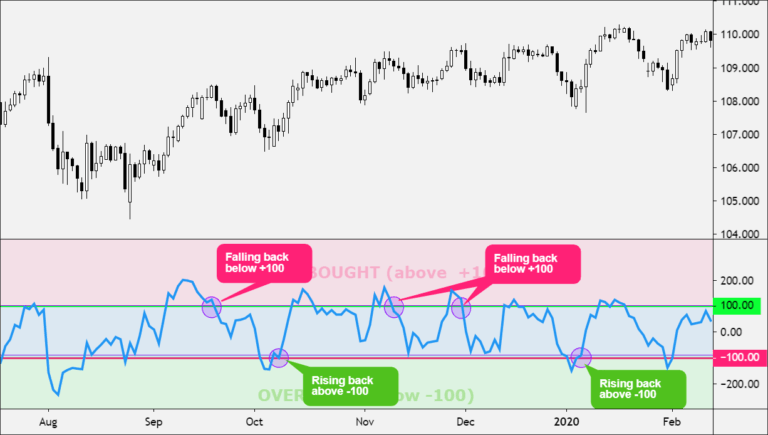
Buy Signal
- When the CCI moves above +100, the price is considered to be entering into a strong uptrend and a buy signal is given.
- The position should be closed when the CCI moves back below +100.
Sell Signal
- When the CCI moves below -100, the price is considered to be in a strong downtrend and a sell signal is given.
- The position should be closed when the CCI moves back above -100.
How to Use (CCI)
The CCI is a versatile indicator and can be used in different ways.
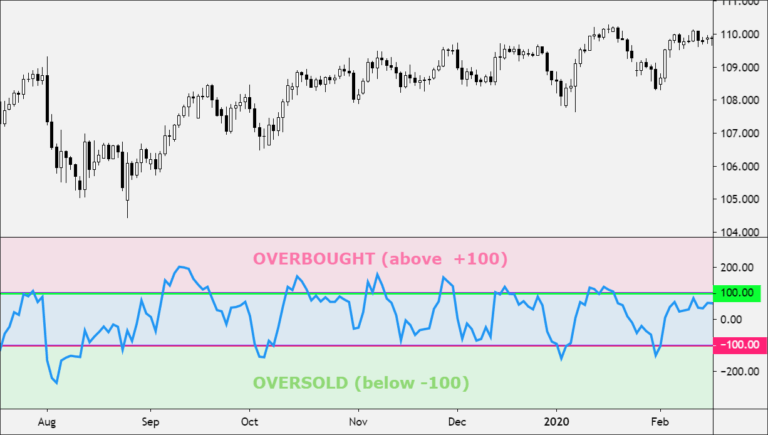
Overbought and Oversold Levels
CCI is used to identify overbought and oversold levels.
- An asset is considered oversold when the CCI falls below -100.
- From oversold levels, a buy signal might be given when the CCI moves back above -100.
- An asset is considered overbought when the CCI rises above +100.
- From overbought levels, a sell signal might be given when the CCI moved back below +100.
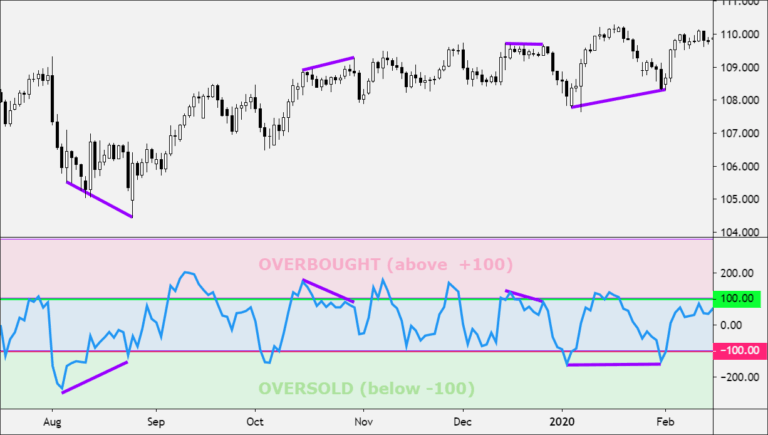
CCI Divergence
As with most oscillators, divergences between the indicator and the actual price action can also be applied to increase the strength of signals.
- A positive divergence below -100 would increase the strength of a signal based on a move back above -100.
- A negative divergence above +100 would increase the strength of a signal based on a move back below +100.
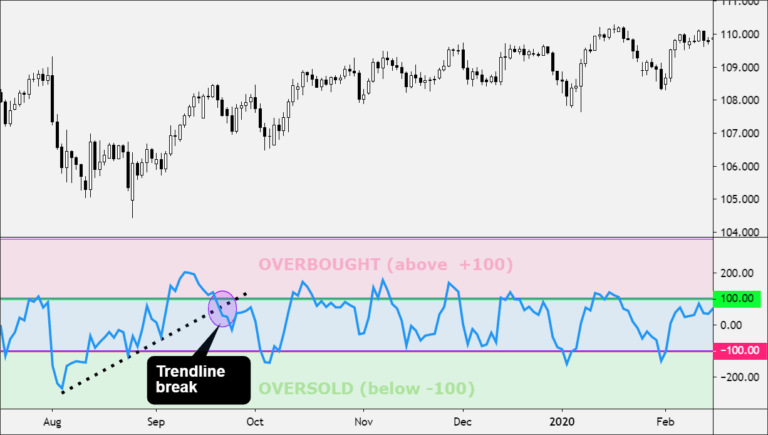
CCI Trend Line Breaks
Trend line breaks can be used to generate signals. Trend lines can be drawn connecting the peaks and troughs.
- From oversold levels, an advance above -100 and trend line breakout is considered bullish.
- From overbought levels, a decline below +100 and a trend line break is considered bearish.
Traders use the CCI to help identify price reversals, price extremes, and trend strength.
As with most technical indicators, the CCI should be used in conjunction with other forms of technical analysis.
Calculation
The proper calculation of the CCI requires several steps.
They are listed in the proper sequence below.
You must first compute the typical price, using the high, low, and close for the interval. It is the simple arithmetic average of the three values.
The formula is:
TP = (High + Low + Close) / 3
- TP represents the typical price.
- High is the highest price for this interval.
- Low is the lowest price for this interval.
- Close is the closing price for this interval.
Next, you calculate a simple moving average of the typical price for the number of periods specified.
TPAVG = (TP1 + TP2 +... + TPn) / n
- TPAVG is the moving average of the typical price.
- TP is the typical price for the nth interval.
- n is the number of intervals for the average.
The next step is rather complex; it computes the mean deviation. The formula is:
MD = (|TP1 - TPAVG1| +... + | TPn - TPAVGn |) / n
- MD is the mean deviation for this interval.
- TPn is the typical price for the nth interval.
- TPAVGn is the moving average of the typical price for the nth interval.
- n is the number of intervals.
The symbol | | designates absolute value. In mathematical terms, negative differences are treated as positive values. Now, the computation for the final CCI value is:
CCI = (TPt - TPAVGt) / (.015 * MDT)
- CCI is the Commodity Channel Index for the current period.
- TPt is the typical price for the current period.
- TPAVGt is the moving average of the typical price.
- .015 is a constant.
- MDT is the mean deviation for this period.
For scaling purposes, Lambert set the constant at .015 to ensure that approximately 70 to 80 percent of CCI values would fall between -100 and +100.
If this article seems useful to your then please click the like button below. You can also share your valuable feedback or ask questions in the below comment section. Also, subscribe to our newsletter for trading-related updates.


