


The Demarker Indicator is a technical analysis tool developed by Tom Demarker for identifying high-risk buying or selling areas in a given market.
Two variants of the Demarker Indicator exist, one bounded by values from -100 to 100, the other bounded by values from 0 to 1. The basic principle behind the Indicator is the same in either case. If the high price for a period is higher than the previous period’s high, the DeMax variable for that period is the difference between the highs; the DeMin variable for the period works similarly for the low prices. The Demarker Indicator is then the moving average of DeMax divided by the sum of the moving averages of DeMax and DeMin. Thus, the higher the value of DeMax relative to DeMin, the greater the value of the Demarker Indicator.
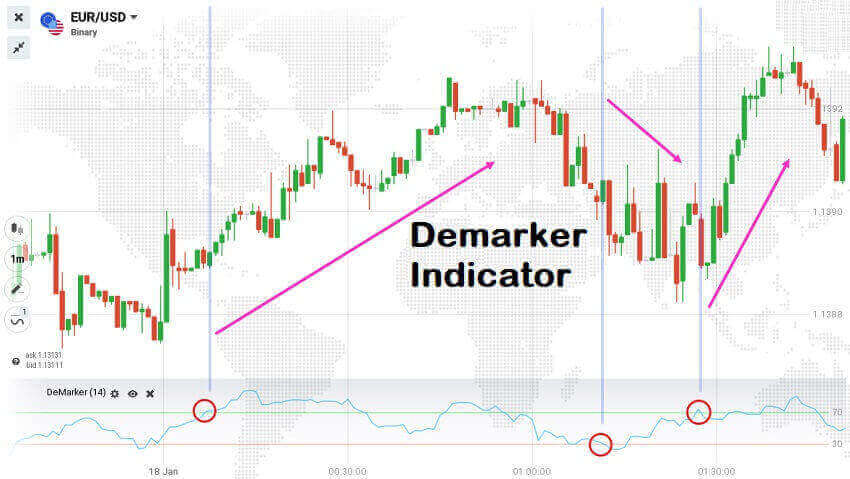
On the 0 to 1 Demarker Indicator scale, a value anywhere above .7 indicates that a downward price turn is imminent, while a value anywhere below .3 indicates that the price will shortly turn upward. Values between .3 and .7 indicate relatively low-risk periods for entering a given asset market. Thus savvy traders can use the Demarker Indicator either to determine when to enter a market, or when to buy or sell an asset in order to capitalize on probable imminent price trends.
If this article seems useful to your then please click the like button below. You can also share your valuable feedback or ask questions in the below comment section. Also, subscribe to our newsletter for trading-related updates.


