


An Inverted Hammer is a single Japanese candlestick pattern.
It is a bullish reversal pattern.
In a downtrend, the open is lower, then the price trades higher, but closes near its open.
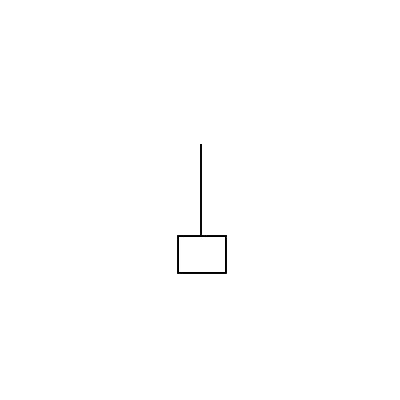
The Inverted Hammer candlestick pattern consists of a black or a white candlestick in an upside-down Hammer position.
The bearish version of the Inverted Hammer is the Shooting Star that occurs after an uptrend.
After a long downtrend, the formation of an Inverted Hammer is bullish because the decrease in price was limited staying near the open price.
Instead, the price was able to rise but sellers returned and pushed the price back near the open.
The fact that prices were able to increase significantly shows that there is buying pressure.
What happens during the next candlestick after the Inverted Hammer pattern is what gives traders an idea as to whether or not the price will push higher.
How to Identify an Inverted Hammer
To identify an Inverted Hammer candlestick pattern, look for the following criteria:
- The candle must occur after a downtrend.
- The upper shadow must be at least two times the height of the candle’s body.
- The lower shadow should either not exist or be very small.
- The body should be located at the lower end of the trading range.
- The color of this small body isn’t important, though the color can suggest slightly more bullish or bearish bias.
How to Trade the Inverted Hammer
The Inverted Hammer candlestick formation occurs mainly at the bottom of downtrends and can act as a warning of a potential trend reversal.
- The longer the upper shadow, the more likely it is that a reversal will occur.
- A gap down from the previous candle’s close sets up a stronger reversal.
- Large volume on the session that the Inverted Hammer occurs increases the likelihood that a blowoff top has occurred.
- A white body has a more bullish bias. A black body has a more bearish bias.
- The pattern is a warning of potential price change, not a signal, in and of itself, to buy.


