


Parabolic SAR Indicator – All of the indicators we have discussed so far provide guidance before a new trend begins. That is, prices provide an idea of when a trend can change.
Knowing when a new trend will begin is very important for a trader because profit can only be made from market trends. But it is far more important to know when this trend will end.
Let’s look at an example –
Today we will be discussing an indicator that will help us get an idea of where market trends may end. This is a Parabolic SAR Indicator which means the entire SAR –
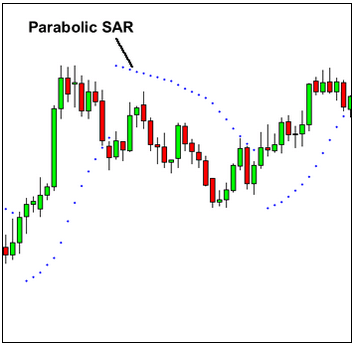
In the trading chart, this indicator draws some dots or points that give us an idea of when the price may reverse or if we should say when the trend will change.
In the figure above, you can see how these points have moved from the bottom of the candle to the top during the uptrend and how the points have come down from the top of the candle during the downtrend.
How to use Parabolic SAR
The best aspect of this indicator is its ease of use. Simple money is a little easier.
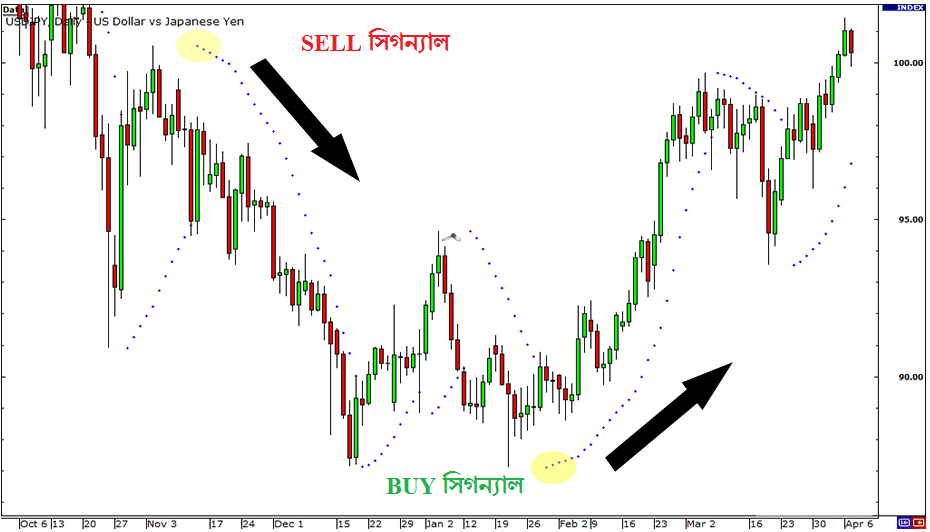
In a word, when these dots or points are below the candle, it will provide a BUY signal.
Again, when this dot or points are above the candle, it will provide a Sell signal.
Not easy to say? That’s what we think!
In Forex trading, this indicator is the easiest to use because only a price indicates where it will go. Such as up / up or down / down.
This indicator works best when the market is trending. We recommend that you do not use this indicator when the price is rotating in a certain position, ie in a ranking position.
How to close entry with Parabolic SAR Indicator?
With an illustration, I am clear about this! The chart below is of the EUR / USD currency pair D time frame. Let’s see how using this indicator we will get instructions for closing the entry from the trade!
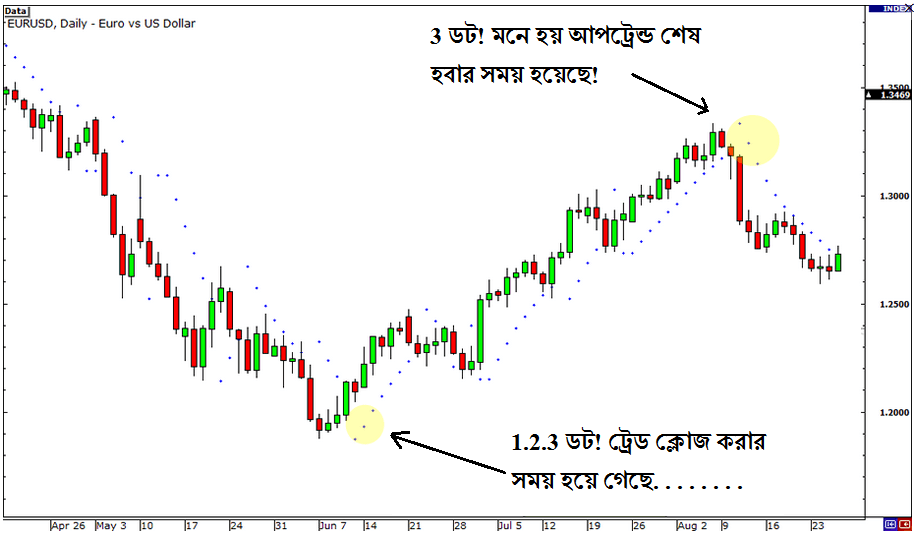
A simple formula – When you make an entry in a trend and you see that the dot or points of the indicator are being formed in the opposite direction, then you will close the entry after it has become 5 points.
Buy entry at closing time = When the price is in the uptrend, the dot or points will be positioned below the candle and when the position of these dots or points will be moved to the top of the candle and 5 candles will be formed, then we will understand when closing the entry. It’s gone.
Sell entry at closing time = When the price is in downtrend, the dot or points will be positioned above the candle and when the position of these dots or points will be moved to the bottom of the candle and 5 points will be formed after closing our cell entry. It’s gone.
If this article seems useful to your then please click the like button below. You can also share your valuable feedback or ask questions in the below comment section. Also, subscribe to our newsletter for trading-related updates.


