


One of the most popular indicators for Forex trading is RSI Indicator. About 5% of the people who are doing real trade are trading using this indicator. In today’s article, we will try to present to you the detailed information about this indicator and show how to trade using this. Please read the article thoroughly and try to understand it. If you have any problem understanding the details, please let us know in the comments section below or you can email us. For the sake of your understanding, we have tried to present the details in a video format. If you want, you can watch it from the link below or read the entire article. So let’s get started –
– Video Tutorial –
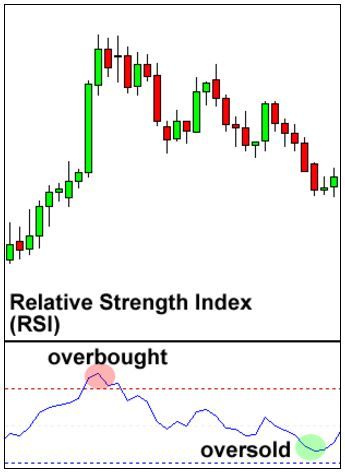
RSI = Relative Strength Index
It works much like a stochastic, meaning it also indicates the Overbought and Oversold conditions of the market. It also has a measuring scale with values ranging from 0 to 100. This popular indicator has been developed by a Technical Analyst J. Welles Wilder to help traders to identify the strength of the current market.
When the readings go down below 30 it indicates that the market has Oversold and when the reading goes above 70, it represents the Overbought Condition.
Many traders are often using this Indicator looking for the Centerline Crossovers. As we have mentioned earlier, it is scaled from 0 to 100 readings and if we do calculate the average of these two readings we will get a value of centerline value of 50.
If price is moving below the centerline (50) to the above direction it actually indicates a rising trend. A centerline crossover may happen when the RSI Reading is turning from below 50 levels and heading towards the overbought zone that means 70 levels.
This indicates the market trend strength is increasing and can be treated as a bullish signal until the line approaches the 70 zones.
on the other hand, If price is moving above the centerline (50) to the below direction it actually indicates a falling trend. A centerline crossover may happen when the RSI Reading is turning from above 50 levels and heading towards the oversold zone that means 30 levels.
This indicates the market trend strength is weakening and can be treated as a bearish signal until the line approaches the 30 zones.
How to use it?
The RSI Indicator can be used much like Stochastic. As we have mentioned earlier, it is scaled from 0 to 100 readings. This indicator is used by traders to identify the best position in the market. That means we’re talking about Overbought and Oversold. Look at the chart of EURUSD-H4 below,
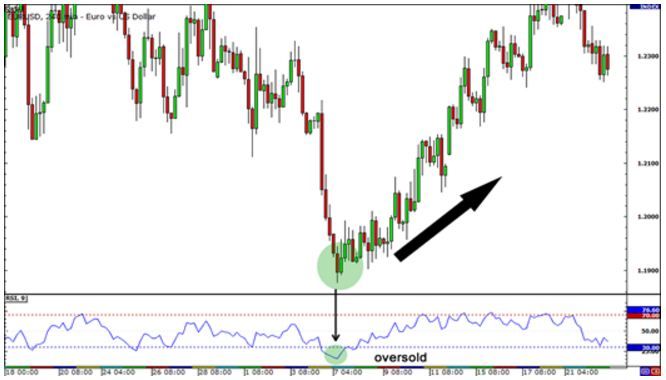
EURUSD is in a Sell position this week which has dropped to a total of 400 pips over the past two weeks. As of June 7, it is down to 1.2000. Now we can see that the RSI reading has dropped to 30 and RSI is giving us a possible buy signal. This means that there is no Seller left in the market and the market can be headed back up over the next couple of weeks at any time.
Determining Market Trend
RSI Indicator is a very popular tool of technical analysis and it is used to confirm the trend formation. If you ever feel that a new trend is being created in the market, you should take a look at your RSI Indicator reading to see if it is above 50 or below 50.
 If you think there is a potential uptrend (Buy) possibility, be sure that RSI’s readings are above 50.
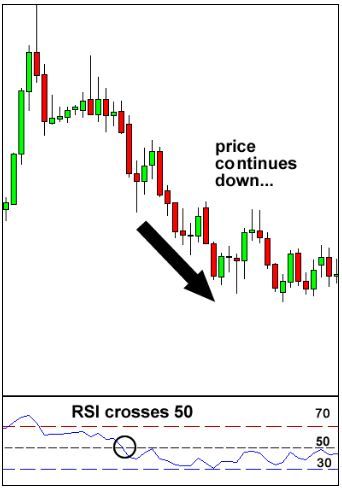
And if you think there is a potential possibility of a downtrend, then RSI readings are below 50 or not.
At the beginning of the chart, we saw the possibility of a downtrend being created. We can wait until the RSI Indicator readings fall below 50 to avoid the fakeouts.
To be sure, we will see if the RSI Indicator’s reading has crossed 50, it will give us good sell instructions.
We hope we are able to give you some idea about RSI Indicator with some examples. You can use it in your trading and check the results. Please be sure to use any indicator in your Demo Trading first. If you need to know any else regarding this indicator or have any confusion, use our comment section or you can send us an email.
If this article seems useful to your then please click the like button below. You can also share your valuable feedback or ask questions in the below comment section. Also, subscribe to our newsletter for trading-related updates.


