


Camarilla Pivot Points is a modified version of the classic Pivot Point.
Camarilla Pivot Points were introduced in 1989 by Nick Scott, a successful bond trader.
The basic idea behind Camarilla Pivot Points is that price has a tendency to revert to its mean until it doesn’t.
What makes it different than the classic pivot point formula is the use of Fibonacci numbers in its calculation of pivot levels.
Camarilla Pivot Points is a math-based price action analysis tool that generates potential intraday support and resistance levels.
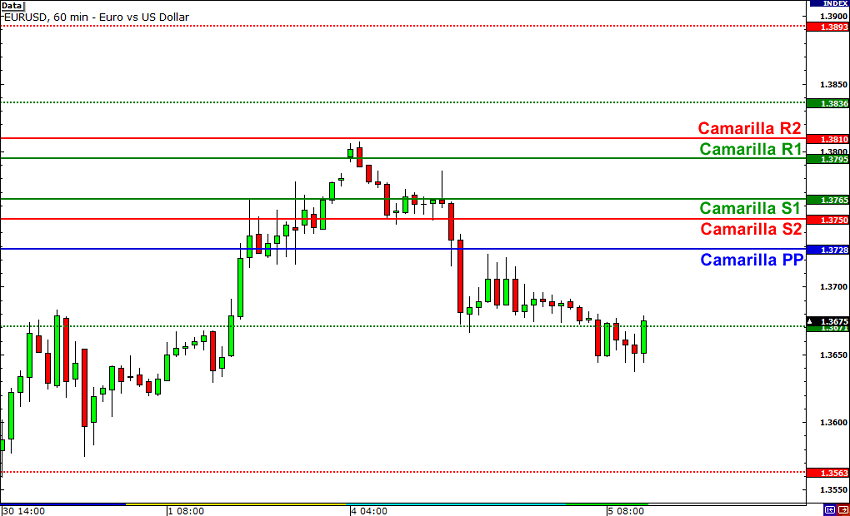
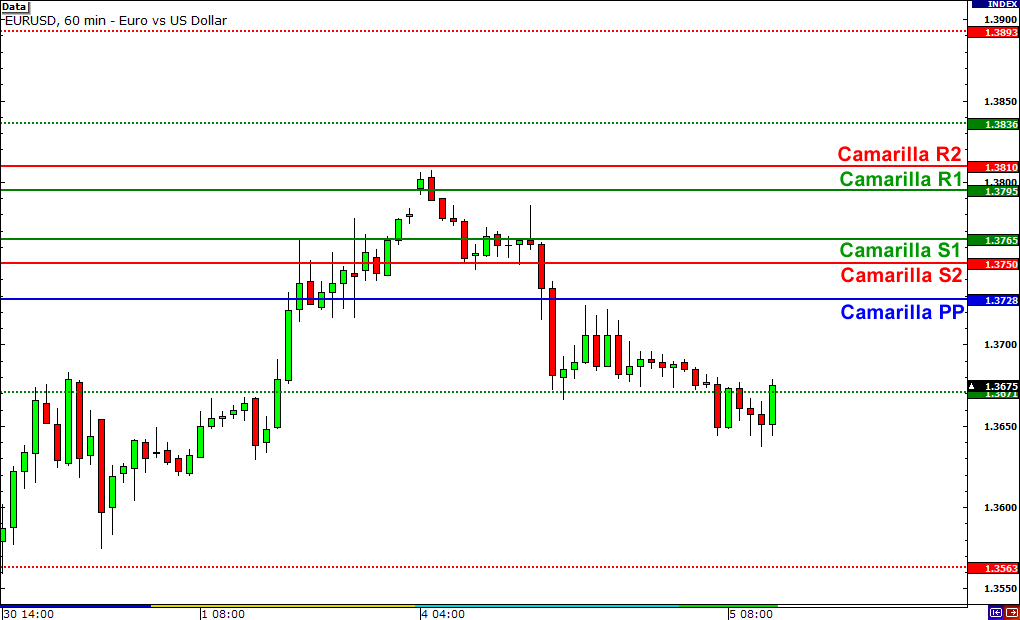
Similar to classic pivot points, it uses the previous day’s high price, low price, and closing price. Camarilla Pivot Points are a set of eight levels that resemble support and resistance values for a current trend.
These pivot points work for all traders and help in targeting the right stop loss and profit target orders.
C = Previous day’s close
H = Previous day’s high
L = Previous day’s low
R4 = (H – L) x 1.1 / 2 + C
R3 = (H – L) x 1.1 / 4 + C
R2 = (H – L) x 1.1 / 6 + C
R1 = (H – L) x 1.1 / 12 + C
S1 = C – (H – L) x 1.1 / 12
S2 = C – (H – L) x 1.1 / 6
S3 = C – (H – L) x 1.1 / 4
S4 = C – (H – L) x 1.1 / 2
The most important levels are S3.S4 and R3, R4.
R3 and S3 are the levels to go against the trend with a stop loss placed around R4 or S4.
While S4 and R4 are considered as breakout levels when these levels are breached it’s time to trade with the trend.
How to Use Camarilla Pivot Points
Camarilla Pivot Points offer guidance for both sideways and trending markets.
Trading the Camarilla Pivot Points is done on the basis of open price on the next day (or session).
Depending on where the price opens, the tool can suggest a trade that could exploit a reversion to the mean or a breakout to new highs or lows.
Here are five different scenarios showing how traders can trade with Camarilla Pivot Points.
Scenario #1: Open price is between R3 and S3
- Buy when the price moves back above S3 after going below S3. Target will be R1, R2, R3 levels.
- Place Stop loss at the S4 level
- Wait for the price to go above R3 and then when it moves back below R3 again, sell or go short.
- Profit target will be S1, S2 S3 levels and stop-loss above R4
Scenario #2: Open price is between R3 and R4
- Buy when the price moves back above R3 again after going below R3. Target will be 0.5%, 1% and 1.5% .
- Place stop loss at R3
- Wait for the price to go above S3 and then when it moves back below S3 again, sell or go short.
- Target will be S1,S2,S3 levels, and the stop loss will be above R4. Target S1, S2, and S3.
Scenario #3: Open price is between S3 and S4
- Wait for the price to go above S3 and then when it moves back above S3 again, then go long.
- Target will be R1,R2 R3 levels, and stop loss below S4.
- Wait for the price to go below S4 and then when it moves below S4, go short.
- Place stop loss above S3. Target 0.5%, 1% and 1.5%
Scenario #4: Open price is above R4
- Buying can be risky at this level. Wait for the price to go below R3.
- As soon as the price moves below R3. go short.
- Place stop loss above (R4+R3)/2. Target S1 , S2 and S3
Scenario #5: Open price is below S4
- Selling could be risky at this level as the price has opened with a big gap down.
- Wait for the price to go above S3.
- When the price moves above S3, buy
- Place a stop loss of (S4+S3)/2. Target R1, R2, and R3.
These are five scenarios on how to use Camarilla Pivot Points. For better results, try combining Camarilla Pivot Points with other technical indicators like Stochastic, RSI, and MACD.
If this article seems useful to your then please click the like button below. You can also share your valuable feedback or ask questions in the below comment section. Also, subscribe to our newsletter for trading-related updates.


